
|
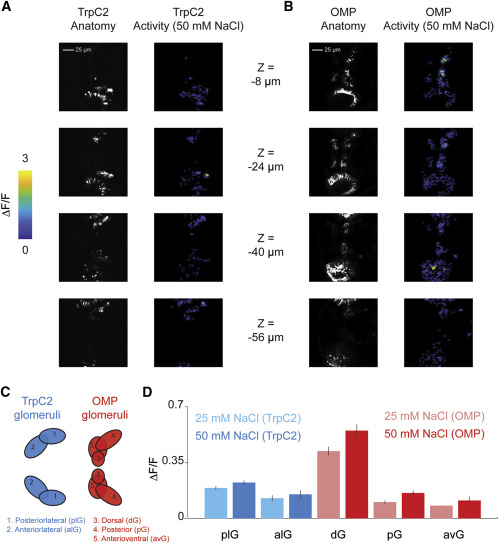
Fig. 6 (A) Sample slices from a stack taken during imaging trpc2:Gal4;uas:GCaMP6s. Left column images are maximum intensity projects, although the right column shows average maximal activity (ΔF/F) during a 50 mM NaCl trial. (B) Sample slices from a stack taken during imaging omp:Gal4;uas:GCaMP6s. Left column images are maximum intensity projects, although the right column shows average maximal activity during a 50 mM NaCl trial. (C) Schematic depicting anatomical locations of glomeruli in omp and trpc2 fish used to generate (D). (D) Average across trials, cells, and fish (error bars: SEM across fish; n = 3) of the maximum activity elicited by 25 mM NaCl or 50 mM NaCl within each of the glomeruli defined in (C).