
|
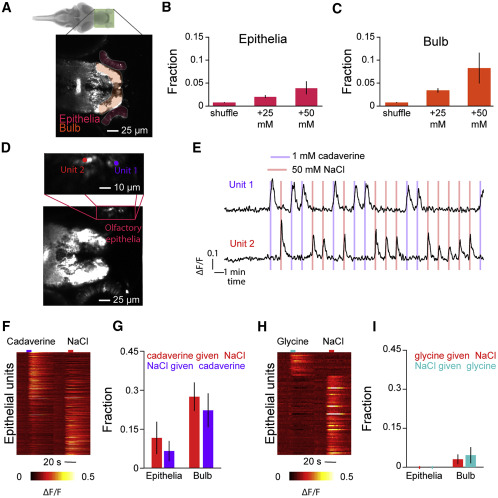
Fig. 5 (A) Plane from the imaged region. Shadings indicate segmented regions—olfactory bulb (orange) and epithelia (red). (B) Average fraction of active units in the olfactory epithelia of huc:GCaMP6s-positive fish during 25-mM or 50-mM pulses and after applying the same criteria to shuffled traces (error bars indicate SEM across fish; n = 3 fish). (C) Average fraction of active units in the olfactory bulb of huc:GCaMP6s-positive fish during 25-mM or 50-mM pulses and after applying the same criteria to shuffled traces (error bars indicate SEM across fish; n = 3 fish). (D) Projection across time of a sample slice imaged with 1 mM cadaverine and 50 mM NaCl. Inset depicts the location of two sample units from within the olfactory epithelia. (E) Calcium traces of the two units depicted in (F) in response to 10-s pulses of 1 mM cadaverine or 50 mM NaCl. (F) Heatmap depicting stimulus-triggered average activity of all responsive epithelial units to cadaverine and NaCl. (G) Fraction of units that are responsive to NaCl that are also responsive to cadaverine and vice versa (error bars indicate SEM across fish; n = 3 fish). (H) Heatmap depicting stimulus-triggered average activity of all responsive epithelial units to glycine and NaCl. (I) Fraction of units that are responsive to NaCl that are also responsive to glycine and vice versa (error bars indicate SEM across fish; n = 3 fish).