FIGURE SUMMARY
Title

Dual function of perivascular fibroblasts in vascular stabilization in zebrafish

Authors
Rajan, A.M., Ma, R.C., Kocha, K.M., Zhang, D.J., Huang, P.
Source
Full text @ PLoS Genet.

Characterization of perivascular fibroblasts in zebrafish.

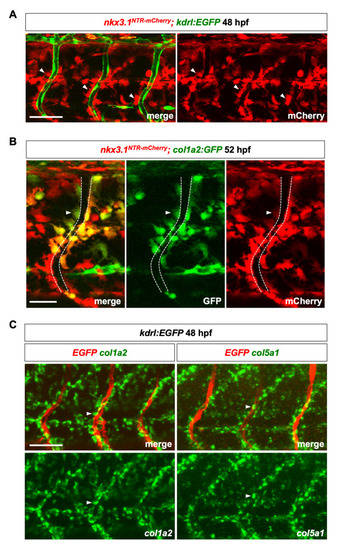
(A) Lateral view of a three somite region in nkx3.1NTR-mCherry; kdrl:EGFP embryos at 48 hpf. Many mCherry+ perivascular fibroblasts (red, arrowheads) were closely associated with intersegmental vessels (ISVs) labeled by the endothelial marker kdrl:EGFP (green). n = 11 embryos. (B) Co-expression of nkx3.1NTR-mCherry and col1a2:GFP in perivascular fibroblasts (arrowheads) at 52 hpf. The ISV is indicated by dashed lines. Graph showing proportion of perivascular fibroblasts labeled by col1a2:GFP is shown in S1A Fig. n = 17 embryos. (C) Fluorescent mRNA in situ hybridization showing expression of fibrillar collagens col1a2 (green, left) and col5a1 (green, right) in perivascular fibroblasts (arrowheads) along ISVs marked by kdrl:EGFP (red) at 48 hpf. n = 15 embryos per staining. Scale bars: (A,C) 50 μm; (B) 25 μm.

Generation of perivascular fibroblasts from different sclerotome domains.

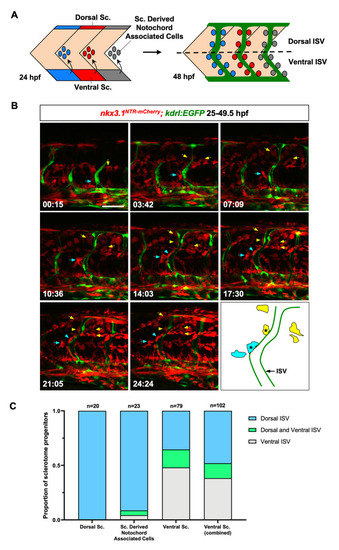
(A) Schematic representation of the bipartite organization of the zebrafish sclerotome and the generation of perivascular fibroblasts. At 24 hpf, the zebrafish sclerotome in each somite is divided into three compartments: the dorsal sclerotome, the ventral sclerotome, and sclerotome derived notochord associated cells. Note that notochord associated cells originate from the ventral sclerotome and are located about half-somite posterior to the corresponding somite. At 48 hpf, perivascular fibroblasts appear along the length of the intersegmental vessels (ISVs, green). The dotted line indicates the position of the horizontal myoseptum, which divides any given ISV into a dorsal half and a ventral half. Perivascular fibroblasts were quantified based on their final locations along each ISV: dorsal ISV (above the horizontal myoseptum) or ventral ISV (below the horizontal myoseptum). Sc: sclerotome. (B) Snapshots from time-lapse imaging of a nkx3.1NTR-mCherry; kdrl:EGFP embryo from 25 hpf to 49.5 hpf. Perivascular fibroblasts along ISVs were retrospectively traced to determine their cell of origin. One cell from the ventral sclerotome domain (cyan arrows) and one cell from sclerotome derived notochord associated cells (yellow arrows) were traced over 24.5 hours with their daughter cells indicated by the same colored arrows/arrowheads. Both sclerotome progenitors divided at least once to give rise to one perivascular fibroblast (arrowheads) as well as several interstitial cells (arrows). A schematic representation of color-coded traced cells at the last time point is shown with perivascular fibroblasts indicated by asterisks. The corresponding time-lapse movie is shown in S1 Video. n = 6 embryos. (C) Quantification of the contribution of each sclerotome domain to perivascular fibroblasts. Sclerotome progenitors from each domain were quantified based on the final dorsoventral location of perivascular fibroblasts along each ISV. A given sclerotome progenitor can give rise to perivascular fibroblasts in only dorsal ISV, in only ventral ISV, or in both dorsal and ventral ISV as indicated in (A). The ventral sclerotome (combined) group includes progenitors from both the ventral sclerotome domain and sclerotome derived notochord associated cells. n = 122 sclerotome progenitors from 6 embryos. Scale bar: 50 μm.

Perivascular fibroblasts are distinct from pericytes.

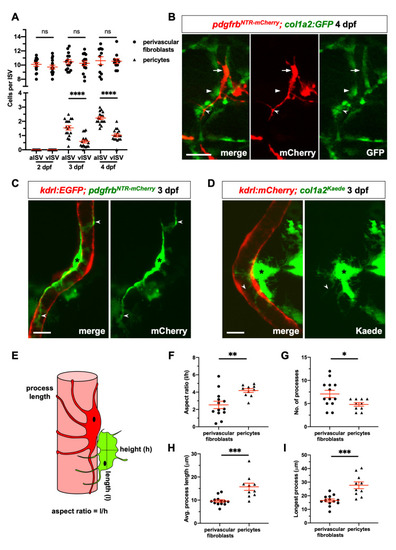
(A) Quantification of perivascular cell numbers along arterial ISVs (aISVs) and venous ISVs (vISVs) at 2, 3, and 4 dpf. The number of perivascular fibroblasts and pericytes were scored in nkx3.1NTR-mCherry; kdrl:EGFP and pdgfrb:GFP; kdrl:mCherry embryos, respectively. Arterial and venous ISV identity was determined based on the connection to either the dorsal aorta (DA) or posterior caudal vein (PCV), respectively. Each data point represents the average cell number of 8–10 ISVs from an individual embryo. Data are plotted with mean ± SEM indicated. n = 11–15 (nkx3.1NTR-mCherry; kdrl:EGFP) and 17 (pdgfrb:GFP; kdrl:mCherry) embryos at each time point. (B) pdgfrbNTR-mCherry; col1a2:GFP embryos were imaged at 4 dpf to visualize perivascular fibroblasts and pericytes. No overlap in marker expression was observed between pdgfrbNTR-mCherry-positive pericytes (red, arrows) and col1a2:GFP-positive perivascular fibroblasts (green, arrowheads). Unlike perivascular fibroblasts, pericytes also displayed elongated cellular processes (notched arrowheads). n = 14 embryos. (C) pdgfrbNTR-mCherry; kdrl:EGFP embryos were imaged at 3 dpf to visualize individual pericytes (green, asterisks) with long cellular processes (notched arrowheads) that wrapped around the ISV (red). (D) Mosaic col1a2Kaede line was imaged to visualize a single perivascular fibroblast (green, asterisks) associated with an ISV (red) in col1a2Kaede; kdrl:mCherry embryos at 3 dpf. (E-I) Cell morphology, number of processes, and process length were quantified and graphed for single perivascular fibroblasts and pericytes using ImageJ as shown in (E). Perivascular fibroblasts showed an overall globular morphology as indicated by smaller aspect ratio (F) with more abundant (G) but shorter processes (H, I) compared to pericytes. n = 13 cells (perivascular fibroblasts), and 10 cells (pericytes). Data are plotted as mean ± SEM. Statistics: Mann-Whitney U test. Asterisk representation: p-value < 0.05 (*), p-value < 0.01 (**), p-value < 0.001 (***). Scale bars: (B) 25 μm; (C,D) 10 μm.

Perivascular fibroblasts function as pericyte progenitors.

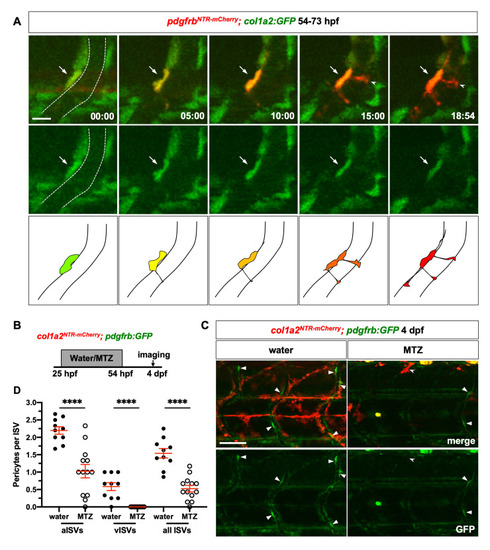
(A) Snapshots from time-lapse imaging of pdgfrbNTR-mCherry; col1a2:GFP embryos from 54 to 73 hpf. Newly differentiated pericytes were retrospectively traced to identify their cell of origin. The ISV is outlined by dotted lines at the first time point. One perivascular fibroblast (green, arrows) traced can be seen gradually upregulating pdgfrbNTR-mCherry expression and extending pericyte-like cellular processes (notched arrowheads). The time stamps are indicated in the hh:mm format. Schematic drawings of the merged images at each time point are shown at the bottom. The corresponding time-lapse movie is shown in S2 Video. n = 7 embryos. (B) Schematic showing experimental timeline of perivascular fibroblast ablation. col1a2NTR-mCherry; pdgfrb:GFP embryos were incubated in either water or metronidazole (MTZ) from 25 to 54 hpf following which embryos were washed at 54 hpf and imaged at 4 dpf to visualize pericytes. (C) Representative images of water (left) or MTZ (right) treated col1a2NTR-mCherry; pdgfrb:GFP embryos at 4 dpf. Compared to water-treated control embryos, MTZ-treated embryos showed complete ablation of mCherry+ cells with only residual mCherry+ debris (notched arrowheads). Fewer pdgfrb:GFPhigh pericytes (arrowheads) can be seen in MTZ-treated embryos compared to water-treated controls. (D) Quantification of pericyte number after perivascular fibroblast ablation along aISVs and vISVs. Pericytes were identified based on high level expression of the pdgfrb:GFP reporter as shown in (C) and S3A and S3C Fig. Arterial versus venous ISVs were determined based on direction of the blood flow in each vessel. From each embryo, 8–10 ISVs in the mid-trunk region were imaged and scored. The average number of pericytes on aISVs, vISVs, or all ISVs were plotted in the graph with each data point representing one individual embryo. Pericytes were lost along both aISVs and vISVs after MTZ treatment. n = 10 (water) and 13 (MTZ) embryos. Data are plotted as mean ± SEM. Statistics: Mann-Whitney U test. Asterisk representation: p-value < 0.0001 (****). Scale bars: (A) 10 μm; (C) 50 μm.

Perivascular fibroblasts stabilize nascent blood vessels by collagen deposition.

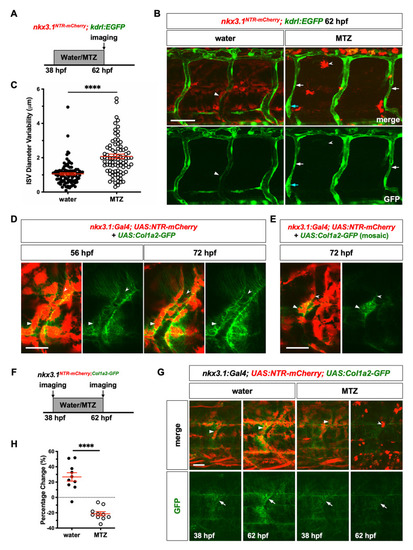
(A) Schematic of experimental protocol for early ablation of perivascular fibroblasts. nkx3.1NTR-mCherry; kdrl:EGFP embryos were incubated in either water or metronidazole (MTZ) from 38 to 62 hpf and imaged to visualize ISV morphology. (B) Representative images showing water (left) and MTZ (right) treated embryos. Water-treated control embryos had many mCherry+ cells (arrowheads), while MTZ treatment resulted in complete ablation of mCherry+ cells with only mCherry+ debris (notched arrowheads) remaining. MTZ-treated embryos showed visibly deformed ISV morphology with greater variation in vessel diameter (the constricted and dilated regions of ISVs are indicated by white and cyan arrows, respectively) compared to uniform ISVs in controls. (C) Quantification of ISV diameter variability in (B). ISV diameter was measured at 4 equidistant points along each ISV using the line tool in ImageJ. Mean diameter of each ISV was calculated and standard deviation from the mean was plotted as a readout of diameter variability in each ISV examined. MTZ-treated embryos showed significantly more variable ISVs compared to water-treated controls. Vessel diameter and variability measurements for the dorsal aorta and posterior cardinal vein are shown in S4 Fig. n = 98 ISVs from 11 embryos (water); 86 ISVs from 10 embryos (MTZ). Results are graphed as mean ± SEM. Statistics: Mann-Whitney U test. Asterisk representation: p-value < 0.0001 (****). (D) nkx3.1NTR-mCherry embryo were injected with the UAS:Col1a2-GFP plasmid and imaged at 56 and 72 hpf. Many mCherry+GFP+ perivascular fibroblasts (arrowheads) can be seen surrounding the ISV. Numerous thin GFP+ collagen fibers (notched arrowheads) wrapped around the ISV and the Col1a2-GFP protein deposition appeared to increase from 56 to 72 hpf. n = 16 embryos. (E) nkx3.1NTR-mCherry embryos were injected with a low dose of the UAS:Col1a2-GFP plasmid and imaged at 72 hpf. Col1a2-GFP deposition (notched arrowheads) around an ISV by a single mCherry+GFP+ perivascular fibroblast (arrowheads) can be seen. n = 16 embryos. (F) Schematic of experimental protocol to examine collagen deposition after early ablation of perivascular fibroblasts. nkx3.1:Gal4; UAS:NTR-mCherry; UAS:Col1a2-GFP embryos were incubated in water or metronidazole (MTZ) from 38 to 62 hpf. The same mid-trunk region of individual embryos was imaged prior to and after the drug treatment to visualize Col1a2-GFP deposition. (G) Representative images of water (left) and MTZ (right) treated embryos before and after the drug treatment. Water-treated control embryos showed many mCherry+ cells (arrowheads), while MTZ treatment resulted in complete ablation of mCherry+ cells with only mCherry+ debris (notched arrowhead) remaining post treatment. Control embryos showed an obvious increase in Col1a2-GFP deposition around ISVs (arrows) from 38 to 62 hpf, while MTZ treated embryos showed reduction in Col1a2-GFP during the same time period. (H) Quantification of changes in fluorescence intensity of Col1a2-GFP in (G). GFP intensity was measured for each embryo before and after the drug treatment and percentage change in GFP intensity was calculated using the following formula: (GFPafter—GFPbefore) / GFPbefore x 100%. n = 10 embryos in each condition. Data are plotted as mean ± SEM. Statistics: Mann-Whitney U test. Asterisk representation: p-value < 0.0001 (****). Scale bars: (B) 50 μm; (D,E,G) 25 μm.

Characterization of collagen mutants.

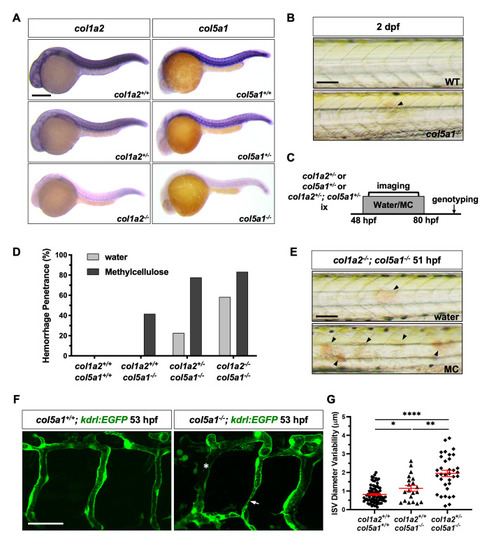
(A) Embryos from intercrosses of col1a2+/- adults or col5a1+/- adults were stained at 24 hpf by mRNA in situ hybridization with col1a2 (left) or col5a1 (right) probes, respectively. Compared to wild type siblings, heterozygous mutants showed reduced staining, and homozygous mutants displayed an almost complete loss of staining for both genes examined. n = 30 embryos for each staining. (B) col5a1-/- mutants but not wild-type siblings showed spontaneous hemorrhage in the trunk (arrowhead) at 2 dpf. (C) Schematic of experimental protocol for phenotypic analysis of collagen mutants. Embryos from intercrosses of 1) col1a2+/- adults, 2) col5a1+/- adults, or 3) col1a2+/-; col5a1+/- adults were incubated in either water or 0.6% methylcellulose (MC) and screened for the hemorrhage phenotype in the trunk from 48 to 80 hpf. All embryos were subsequently genotyped. (D) Quantification of hemorrhage penetrance of embryos from intercrosses of col1a2+/-; col5a1+/- adults described in (C). The hemorrhage penetrance was calculated by dividing the number of embryos with the hemorrhage phenotype by the total number of embryos of the same genotype. n = 12 (col1a2+/+; col5a1+/+ + water); 9 (col1a2+/+; col5a1+/+ + MC); 12 (col1a2+/+; col5a1-/- + water); 12 (col1a2+/+; col5a1-/- + MC); 22 (col1a2+/-; col5a1-/- + water); 27 (col1a2+/-; col5a1-/- + MC); 12 (col1a2-/-; col5a1-/- + water); and 18 (col1a2-/-; col5a1-/- + MC) embryos. (E) In experiments described in (C), embryos were imaged 3 hours after incubation in water (top) or MC (bottom) at 2 dpf and subsequently genotyped. MC-treated col1a2-/-; col5a1-/- embryos showed an increase in the number of hemorrhage foci (arrowheads) compared to water-treated controls. Quantification of this result is shown in S7D Fig. (F) Embryos from crosses of col1a2+/-; col5a1+/- and col5a1+/-; kdrl:EGFP adults were incubated in the 0.6% methylcellulose solution at 48 hpf, and their ISVs were imaged at 53 hpf. col5a1-/-; kdrl:EGFP embryos showed visible ISV constrictions (arrow) and broken ISVs (asterisk) compared to col5a1+/+; kdrl:EGFP siblings. (G) Quantification of ISV diameter variability in embryos from crosses of col1a2+/-; col5a1+/- and col5a1+/-; kdrl:EGFP adults as described in (F). ISV diameter and variability were measured as described in Fig 5. n = 81 ISVs from 10 embryos (col1a2+/+; col5a1+/+; kdrl:EGFP); 20 ISVs from 3 embryos (col1a2+/+; col5a1-/-; kdrl:EGFP); and 34 ISVs from 4 embryos (col1a2+/-; col5a1-/-; kdrl:EGFP). Data are graphed as mean ± SEM. Statistics: Mann-Whitney U test. Asterisk representation: p-value < 0.05 (*); p-value < 0.01 (**); p-value < 0.0001 (****). Scale bars: (A) 250 μm; (B,E) 100 μm; (F) 50 μm.

Model of perivascular fibroblasts in vascular stabilization in zebrafish.

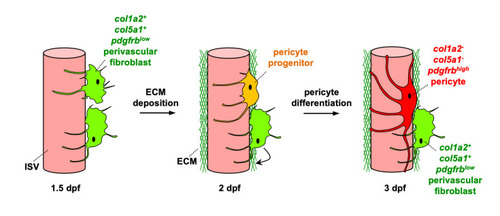
Perivascular fibroblasts, characterized by the expression of fibrillar collagens col1a2 and col5a1 as well as low levels of pdgfrb, become associated with intersegmental vessels (ISVs) in the zebrafish trunk by 1.5 dpf. Perivascular fibroblasts deposit a network of collagen fibers to establish the vascular ECM and stabilize nascent ISVs at 2 dpf and continue to deposit collagen until at least 3 dpf. In the same time window, a subset of perivascular fibroblasts functions as pericyte progenitors. They gradually upregulate the expression of the classic pericyte marker pdgfrb and develop elongated cellular processes. By 3 dpf, these ‘pericyte progenitors’ have completely differentiated into mature pericytes, showing robust pdgfrb expression distinct from collagen-expressing perivascular fibroblasts. Together, perivascular fibroblasts perform dual functions in vascular stabilization by depositing collagens to support nascent blood vessels and acting as pericyte progenitors.

Acknowledgments
This image is the copyrighted work of the attributed author or publisher, and ZFIN has permission only to display this image to its users. Additional permissions should be obtained from the applicable author or publisher of the image. Full text @ PLoS Genet.