IMAGE

Fig 4

ID
ZDB-IMAGE-201119-5
Source
Figures for Rajan et al., 2020
Image
Figure Caption

Fig 4 Perivascular fibroblasts function as pericyte progenitors.

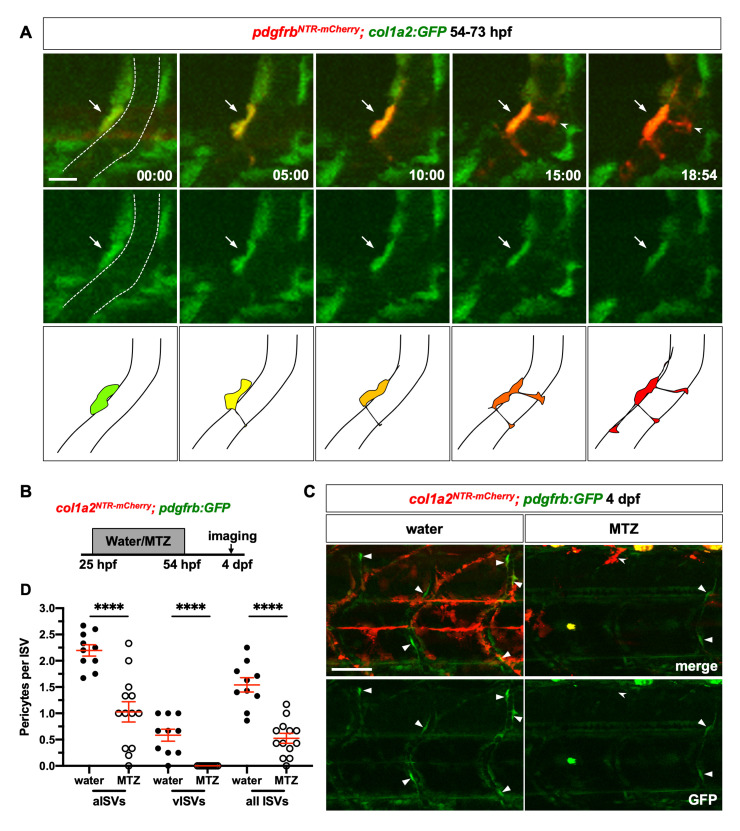
(A) Snapshots from time-lapse imaging of pdgfrbNTR-mCherry; col1a2:GFP embryos from 54 to 73 hpf. Newly differentiated pericytes were retrospectively traced to identify their cell of origin. The ISV is outlined by dotted lines at the first time point. One perivascular fibroblast (green, arrows) traced can be seen gradually upregulating pdgfrbNTR-mCherry expression and extending pericyte-like cellular processes (notched arrowheads). The time stamps are indicated in the hh:mm format. Schematic drawings of the merged images at each time point are shown at the bottom. The corresponding time-lapse movie is shown in S2 Video. n = 7 embryos. (B) Schematic showing experimental timeline of perivascular fibroblast ablation. col1a2NTR-mCherry; pdgfrb:GFP embryos were incubated in either water or metronidazole (MTZ) from 25 to 54 hpf following which embryos were washed at 54 hpf and imaged at 4 dpf to visualize pericytes. (C) Representative images of water (left) or MTZ (right) treated col1a2NTR-mCherry; pdgfrb:GFP embryos at 4 dpf. Compared to water-treated control embryos, MTZ-treated embryos showed complete ablation of mCherry+ cells with only residual mCherry+ debris (notched arrowheads). Fewer pdgfrb:GFPhigh pericytes (arrowheads) can be seen in MTZ-treated embryos compared to water-treated controls. (D) Quantification of pericyte number after perivascular fibroblast ablation along aISVs and vISVs. Pericytes were identified based on high level expression of the pdgfrb:GFP reporter as shown in (C) and S3A and S3C Fig. Arterial versus venous ISVs were determined based on direction of the blood flow in each vessel. From each embryo, 8–10 ISVs in the mid-trunk region were imaged and scored. The average number of pericytes on aISVs, vISVs, or all ISVs were plotted in the graph with each data point representing one individual embryo. Pericytes were lost along both aISVs and vISVs after MTZ treatment. n = 10 (water) and 13 (MTZ) embryos. Data are plotted as mean ± SEM. Statistics: Mann-Whitney U test. Asterisk representation: p-value < 0.0001 (****). Scale bars: (A) 10 μm; (C) 50 μm.

Figure Data
Acknowledgments
This image is the copyrighted work of the attributed author or publisher, and ZFIN has permission only to display this image to its users. Additional permissions should be obtained from the applicable author or publisher of the image. Full text @ PLoS Genet.