|
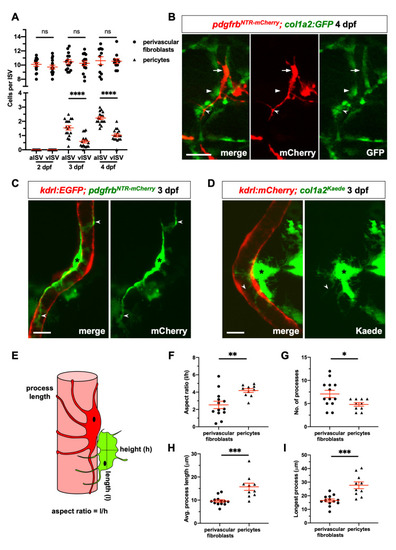
Perivascular fibroblasts are distinct from pericytes.(A) Quantification of perivascular cell numbers along arterial ISVs (aISVs) and venous ISVs (vISVs) at 2, 3, and 4 dpf. The number of perivascular fibroblasts and pericytes were scored in nkx3.1NTR-mCherry; kdrl:EGFP and pdgfrb:GFP; kdrl:mCherry embryos, respectively. Arterial and venous ISV identity was determined based on the connection to either the dorsal aorta (DA) or posterior caudal vein (PCV), respectively. Each data point represents the average cell number of 8–10 ISVs from an individual embryo. Data are plotted with mean ± SEM indicated. n = 11–15 (nkx3.1NTR-mCherry; kdrl:EGFP) and 17 (pdgfrb:GFP; kdrl:mCherry) embryos at each time point. (B) pdgfrbNTR-mCherry; col1a2:GFP embryos were imaged at 4 dpf to visualize perivascular fibroblasts and pericytes. No overlap in marker expression was observed between pdgfrbNTR-mCherry-positive pericytes (red, arrows) and col1a2:GFP-positive perivascular fibroblasts (green, arrowheads). Unlike perivascular fibroblasts, pericytes also displayed elongated cellular processes (notched arrowheads). n = 14 embryos. (C) pdgfrbNTR-mCherry; kdrl:EGFP embryos were imaged at 3 dpf to visualize individual pericytes (green, asterisks) with long cellular processes (notched arrowheads) that wrapped around the ISV (red). (D) Mosaic col1a2Kaede line was imaged to visualize a single perivascular fibroblast (green, asterisks) associated with an ISV (red) in col1a2Kaede; kdrl:mCherry embryos at 3 dpf. (E-I) Cell morphology, number of processes, and process length were quantified and graphed for single perivascular fibroblasts and pericytes using ImageJ as shown in (E). Perivascular fibroblasts showed an overall globular morphology as indicated by smaller aspect ratio (F) with more abundant (G) but shorter processes (H, I) compared to pericytes. n = 13 cells (perivascular fibroblasts), and 10 cells (pericytes). Data are plotted as mean ± SEM. Statistics: Mann-Whitney U test. Asterisk representation: p-value < 0.05 (*), p-value < 0.01 (**), p-value < 0.001 (***). Scale bars: (B) 25 μm; (C,D) 10 μm.
|