IMAGE

Fig 5

ID
ZDB-IMAGE-201119-1
Source
Figures for Rajan et al., 2020
Image
Figure Caption

Fig 5 Perivascular fibroblasts stabilize nascent blood vessels by collagen deposition.

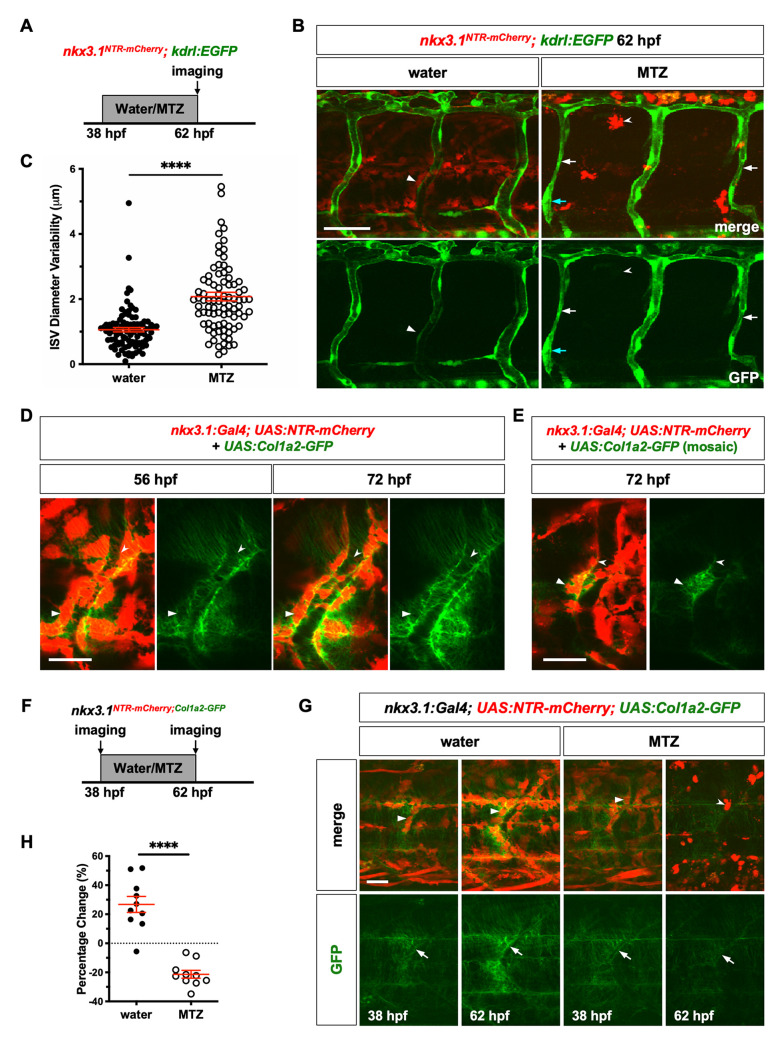
(A) Schematic of experimental protocol for early ablation of perivascular fibroblasts. nkx3.1NTR-mCherry; kdrl:EGFP embryos were incubated in either water or metronidazole (MTZ) from 38 to 62 hpf and imaged to visualize ISV morphology. (B) Representative images showing water (left) and MTZ (right) treated embryos. Water-treated control embryos had many mCherry+ cells (arrowheads), while MTZ treatment resulted in complete ablation of mCherry+ cells with only mCherry+ debris (notched arrowheads) remaining. MTZ-treated embryos showed visibly deformed ISV morphology with greater variation in vessel diameter (the constricted and dilated regions of ISVs are indicated by white and cyan arrows, respectively) compared to uniform ISVs in controls. (C) Quantification of ISV diameter variability in (B). ISV diameter was measured at 4 equidistant points along each ISV using the line tool in ImageJ. Mean diameter of each ISV was calculated and standard deviation from the mean was plotted as a readout of diameter variability in each ISV examined. MTZ-treated embryos showed significantly more variable ISVs compared to water-treated controls. Vessel diameter and variability measurements for the dorsal aorta and posterior cardinal vein are shown in S4 Fig. n = 98 ISVs from 11 embryos (water); 86 ISVs from 10 embryos (MTZ). Results are graphed as mean ± SEM. Statistics: Mann-Whitney U test. Asterisk representation: p-value < 0.0001 (****). (D) nkx3.1NTR-mCherry embryo were injected with the UAS:Col1a2-GFP plasmid and imaged at 56 and 72 hpf. Many mCherry+GFP+ perivascular fibroblasts (arrowheads) can be seen surrounding the ISV. Numerous thin GFP+ collagen fibers (notched arrowheads) wrapped around the ISV and the Col1a2-GFP protein deposition appeared to increase from 56 to 72 hpf. n = 16 embryos. (E) nkx3.1NTR-mCherry embryos were injected with a low dose of the UAS:Col1a2-GFP plasmid and imaged at 72 hpf. Col1a2-GFP deposition (notched arrowheads) around an ISV by a single mCherry+GFP+ perivascular fibroblast (arrowheads) can be seen. n = 16 embryos. (F) Schematic of experimental protocol to examine collagen deposition after early ablation of perivascular fibroblasts. nkx3.1:Gal4; UAS:NTR-mCherry; UAS:Col1a2-GFP embryos were incubated in water or metronidazole (MTZ) from 38 to 62 hpf. The same mid-trunk region of individual embryos was imaged prior to and after the drug treatment to visualize Col1a2-GFP deposition. (G) Representative images of water (left) and MTZ (right) treated embryos before and after the drug treatment. Water-treated control embryos showed many mCherry+ cells (arrowheads), while MTZ treatment resulted in complete ablation of mCherry+ cells with only mCherry+ debris (notched arrowhead) remaining post treatment. Control embryos showed an obvious increase in Col1a2-GFP deposition around ISVs (arrows) from 38 to 62 hpf, while MTZ treated embryos showed reduction in Col1a2-GFP during the same time period. (H) Quantification of changes in fluorescence intensity of Col1a2-GFP in (G). GFP intensity was measured for each embryo before and after the drug treatment and percentage change in GFP intensity was calculated using the following formula: (GFPafter—GFPbefore) / GFPbefore x 100%. n = 10 embryos in each condition. Data are plotted as mean ± SEM. Statistics: Mann-Whitney U test. Asterisk representation: p-value < 0.0001 (****). Scale bars: (B) 50 μm; (D,E,G) 25 μm.

Figure Data
Acknowledgments
This image is the copyrighted work of the attributed author or publisher, and ZFIN has permission only to display this image to its users. Additional permissions should be obtained from the applicable author or publisher of the image. Full text @ PLoS Genet.