IMAGE

Fig 6

ID
ZDB-IMAGE-201119-6
Genes
Source
Figures for Rajan et al., 2020
Image
Figure Caption

Fig 6 Characterization of collagen mutants.

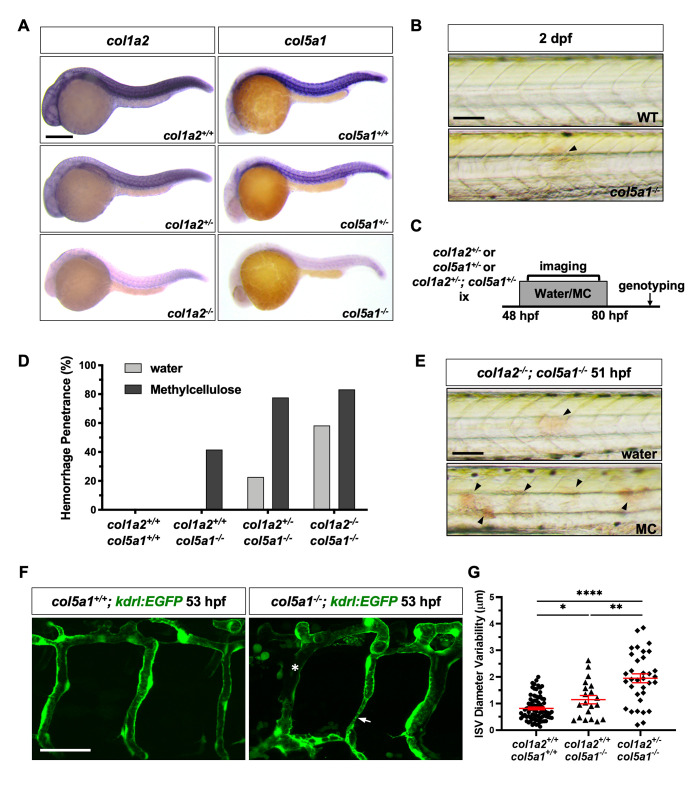
(A) Embryos from intercrosses of col1a2+/- adults or col5a1+/- adults were stained at 24 hpf by mRNA in situ hybridization with col1a2 (left) or col5a1 (right) probes, respectively. Compared to wild type siblings, heterozygous mutants showed reduced staining, and homozygous mutants displayed an almost complete loss of staining for both genes examined. n = 30 embryos for each staining. (B) col5a1-/- mutants but not wild-type siblings showed spontaneous hemorrhage in the trunk (arrowhead) at 2 dpf. (C) Schematic of experimental protocol for phenotypic analysis of collagen mutants. Embryos from intercrosses of 1) col1a2+/- adults, 2) col5a1+/- adults, or 3) col1a2+/-; col5a1+/- adults were incubated in either water or 0.6% methylcellulose (MC) and screened for the hemorrhage phenotype in the trunk from 48 to 80 hpf. All embryos were subsequently genotyped. (D) Quantification of hemorrhage penetrance of embryos from intercrosses of col1a2+/-; col5a1+/- adults described in (C). The hemorrhage penetrance was calculated by dividing the number of embryos with the hemorrhage phenotype by the total number of embryos of the same genotype. n = 12 (col1a2+/+; col5a1+/+ + water); 9 (col1a2+/+; col5a1+/+ + MC); 12 (col1a2+/+; col5a1-/- + water); 12 (col1a2+/+; col5a1-/- + MC); 22 (col1a2+/-; col5a1-/- + water); 27 (col1a2+/-; col5a1-/- + MC); 12 (col1a2-/-; col5a1-/- + water); and 18 (col1a2-/-; col5a1-/- + MC) embryos. (E) In experiments described in (C), embryos were imaged 3 hours after incubation in water (top) or MC (bottom) at 2 dpf and subsequently genotyped. MC-treated col1a2-/-; col5a1-/- embryos showed an increase in the number of hemorrhage foci (arrowheads) compared to water-treated controls. Quantification of this result is shown in S7D Fig. (F) Embryos from crosses of col1a2+/-; col5a1+/- and col5a1+/-; kdrl:EGFP adults were incubated in the 0.6% methylcellulose solution at 48 hpf, and their ISVs were imaged at 53 hpf. col5a1-/-; kdrl:EGFP embryos showed visible ISV constrictions (arrow) and broken ISVs (asterisk) compared to col5a1+/+; kdrl:EGFP siblings. (G) Quantification of ISV diameter variability in embryos from crosses of col1a2+/-; col5a1+/- and col5a1+/-; kdrl:EGFP adults as described in (F). ISV diameter and variability were measured as described in Fig 5. n = 81 ISVs from 10 embryos (col1a2+/+; col5a1+/+; kdrl:EGFP); 20 ISVs from 3 embryos (col1a2+/+; col5a1-/-; kdrl:EGFP); and 34 ISVs from 4 embryos (col1a2+/-; col5a1-/-; kdrl:EGFP). Data are graphed as mean ± SEM. Statistics: Mann-Whitney U test. Asterisk representation: p-value < 0.05 (*); p-value < 0.01 (**); p-value < 0.0001 (****). Scale bars: (A) 250 μm; (B,E) 100 μm; (F) 50 μm.

Figure Data
Acknowledgments
This image is the copyrighted work of the attributed author or publisher, and ZFIN has permission only to display this image to its users. Additional permissions should be obtained from the applicable author or publisher of the image. Full text @ PLoS Genet.