
- Title
-
The Gridlock transcriptional repressor impedes vertebrate heart regeneration by restricting expression of lysine methyltransferase
- Authors
- She, P., Zhang, H., Peng, X., Sun, J., Gao, B., Zhou, Y., Zhu, X., Hu, X., Lai, K.S., Wong, J., Zhou, B., Wang, L., Zhong, T.P.
- Source
- Full text @ Development

Reduction of myocardial grl correlates with regenerative responses of the zebrafish heart to injury. (A-D) grl:EGFP (green or white) overlaps with a nuclear CM marker Mef2 (red) (A) and a cytoplasmic CM marker MHC (red) (B-D). (A1) Enlarged image of the dashed box in A. Arrows indicate the grl-enriched primordial layer (PML). (E) ISH for grl displays enriched expression in the PML and its expression throughout the myocardium in adult zebrafish hearts. (E1) Higher-magnification image of the dashed box in E; arrowheads point to the grl-enriched PML. (E2) Enlarged image of the dashed box in E; arrowheads point to grl expression in the myocardium. (F-H) grl:EGFP (green) does not colocalize with endocardial or coronary endothelial cells marked by flk1:mCherry (red) in adult Tg(grl:EGFP;flk1:mCherry) hearts. Arrows indicate the circular coronary vessels. (I-N) Tg(grl:EGFP) adult heart show grl:EGFP (green) expression in uninjured and regenerating ventricles. (I1-N1) Higher-magnification images of the dashed boxes in I-N. Red dashed line indicates approximate plane of resection. Red asterisks mark decreased expression of grl:EGFP in the injury border zone. (O) Expression of grl, hey1, and heyL were examined using qPCR analyses in uninjured and regeneration ventricular samples. Expression levels were normalized to that of β-actin and further normalized to that of grl in uninjured sample (n=3). Data presents as mean±s.e.m. **P<0.01, ***P<0.001, ****P<0.0001, Student's t-test (unpaired, two-tailed). Scale bars: 100 µm (A-E, I-N); 50 µm (F-H). |
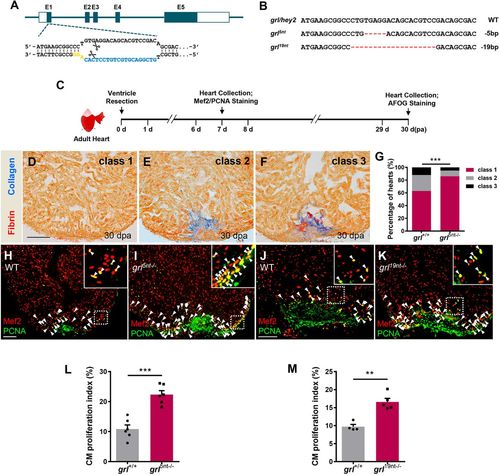
Mutations in Grl lead to enhanced CM proliferation and reduced fibrotic scar tissue following injury. (A) The sgRNA target sequence of the grl allele (blue) and the PAM (yellow) designed in the first exon of grl for mutation generation. (B) Targeted deletion mutations induced by CRISPR/Cas9 technique at the grl genes. The WT sequence is shown at the top. Deletions are shown as red dashes. The mutation deletion is indicated at the right of each sequence. (C) Experimental design for PCNA and Mef2 immunostaining and fibrotic scar (AFOG) analysis. (D-F) Representative AFOG staining images (blue for collagen, red for fibrin) of injured ventricles from WT sibling and grl5nt−/− fish at 30 dpa, scored as ‘class 1’ (complete regeneration) (D), ‘class 2’ (partial regeneration) (E) and ‘class 3’ (blockade in regeneration) (F). (G) Quantification of regenerative status of ventricles from WT sibling fish (n=6, sections=194) and grl5nt−/− fish (n=8, sections=288) at 30 dpa. Heart sections were scored according to the criteria described in Materials and Methods. Histograms show the percentage of heart regeneration represented by each score for each group. ***P<0.001, Chi-square test. (H-K) Section images of injured ventricles from WT (H) and mutant grl5nt−/− fish (I), as well as WT (J) and grl19nt−/− fish (K) at 7 dpa, stained with anti-PCNA (green) and anti-Mef2 (red) antibodies. Insets show higher-magnification images of the dashed boxes. Arrowheads indicate proliferating CMs. (L) Quantification of CM proliferation indices in 7 dpa ventricles of grl+/+ (n=6) and grl5nt−/− fish (n=6). ***P<0.001, Student's t-test (unpaired, two-tailed). (M) Quantification of CM proliferation indices in 7 dpa ventricles of grl+/+ (n=4) and grl19nt−/− fish (n=5). **P<0.01, Student's t-test (unpaired, two-tailed). Data presents as mean±s.e.m. Scale bars: 100 µm. |

Conditional grl induction in the adult myocardium impairs CM dedifferentiation and proliferation during regeneration. (A) Transgenic zebrafish used for inducible expression of Grl-EGFP in CMs. Tg(cmlc2:nRSGG) zebrafish were crossed with Tg(cmlc2:CreER) animals, which permitted Cre-mediated recombination to induce Grl in CMs after 5 µM 4-HT treatment. (B,C) Grl was induced in CMs of 4-HT-treated Tg(cmlc2:creER;cmlc2:nRSGG) hearts (C) but not Tg(cmlc2:nRSGG) hearts (B), as indicated by EGFP protein (green). Insets show higher-magnification images of the dashed boxes adding mCherry channel (red). (D,E) ISH analyses indicate the endogenous expression of grl in WT hearts (D) and the induced expression of grl in CMs of the whole ventricle in 4-HT-treated Tg(cmlc2:creER;cmlc2:nRSGG) animals (E) at 7 dpa. (F) Experimental design for PCNA and Mef2 immunostaining and fibrotic scar (AFOG) analysis after ventricular resection. 4-HT treatment was 5 µM 4-HT for bath treatment for 2 days. (G-I) Section images of 30 dpa ventricles of 4-HT-treated Tg(cmlc2:nRSGG) control fish (G) and 4-HT-treated Tg(cmlc2:creER;cmlc2:nRSGG) animals (H,I) stained with AFOG (blue for collagen, red for fibrin). Heart sections were scored as ‘class 1’, ‘class 2’ or ‘class 3’ according to the criteria described in Materials and Methods. (J) Quantification of regenerative status of ventricles in 4-HT-treated Tg(cmlc2:creER;cmlc2:nRSGG) (n=6; 129 sections) and Tg(cmlc2:nRSGG) control group (n=4; 84 sections) at 30 dpa. Histograms show the percentage of wounded hearts represented by each score for each group. ***P<0.001, Chi-square test. (K,L) Immunofluorescent section images of injured ventricles from 4-HT-treated Tg(cmlc2:nRSGG) control fish (K) and 4-HT-treated Tg(cmlc2:creER;cmlc2:nRSGG) animals (L) at 7 dpa, stained with anti-PCNA (green) and anti-Mef2 (red) antibodies. Insets show higher-magnification images of the dashed boxes. Arrowheads indicate proliferating CMs. (M) Quantification of CM proliferation indices in 7 dpa ventricles; n=11 (cmlc2:nRSGG), n=12 (cmlc2:creER;cmlc2:nRSGG); ***P<0.001, Student's t-test (unpaired, two-tailed). (N-Q) Confocal images of sections of injured ventricles from 4-HT-treated Tg(cmlc2:nRSGG) control fish (N,P) and 4-HT-treated Tg(cmlc2:creER;cmlc2:nRSGG) animals (O,Q) at 7 dpa, stained with anti-α-actinin antibody, showing regions of the remote zone (N and O) and injury site (P and Q). Insets show higher-magnification images of the dashed boxes. Dashed line indicates the apical edge of the regeneration. (R) Quantification of organized sarcomere units in α-actinin-labeled myocardial tissue (100×100 pixels) in injury border zone of 7 dpa ventricles from 4-HT-treated Tg(cmlc2:nRSGG) control fish and 4-HT-treated Tg(cmlc2:creER;cmlc2:nRSGG) animals (n=5); ***P<0.001, Student's t-test (unpaired, two-tailed). (S,T) ISH analyses of nkx2.5 expression in injured ventricles from 4-HT-treated Tg(cmlc2:nRSGG) control fish (S) and 4-HT-treated Tg(cmlc2:creER;cmlc2:nRSGG) animals (T) at 7 dpa (n=5). Brackets indicate injury site. (U,V) Fluorescent images of injured ventricles from 4-HT-treated Tg(cmlc2:nRSGG) control fish (U) and 4-HT-treated Tg(cmlc2:creER;cmlc2:nRSGG) animals (V) at 7 dpa, stained with embCMHC antibody (white). Brackets indicate injury site. (W) Quantification of embCMHC fluorescent area in injury border zone of 7 dpa ventricles from 4-HT-treated Tg(cmlc2:nRSGG) control fish and 4-HT-treated Tg(cmlc2:creER;cmlc2:nRSGG) animals. Data are relative to area in 4-HT-treated Tg(cmlc2:nRSGG) group (n=5); ***P<0.001, Student's t-test (unpaired, two-tailed). Data presents as mean±s.e.m. Scale bars: 100 µm (B-E,G-I,K,L,S-V); 50 µm (N-Q). |

Identification of Smyd2 methyltransferase as candidate Grl target in the regenerating heart. (A) Experimental design for RNA-seq, RT-qPCR and ISH analyses. Red arrows represent experimental steps for Tg(cmlc2:creER;cmlc2:nRSGG) animals and Tg(cmlc2:nRSGG) control fish. Blue arrows represent experimental steps for grl5nt−/− mutant fish and WT sibling fish. (B,C) Bar graph showing −log10 P values for GO terms significantly represented in the downregulated gene category of the grl-overexpressing groups (B) and in the upregulated gene category of the grl mutant groups (C). (D) Heatmap indicating genes downregulated in Tg(cmlc2:creER;cmlc2:nRSGG) hearts and upregulated in grl5nt−/− mutant hearts after resection, compared with control wounded hearts. Red, higher expression; blue, lower expression. FC>1.5, P<0.05. (E) qPCR analyses of smyd1a, smyd1b, smyd2a and smyd2b in injured hearts extracted from Tg(cmlc2:creER;cmlc2:nRSGG), Tg(cmlc2:nRSGG), grl5nt−/− and grl+/+ animals. Data presents as mean±s.e.m. (n=3); *P<0.05, **P<0.01, ***P<0.001, Student's t-test (unpaired, two-tailed). (F-K) ISH analyses of smyd2b expression in uninjured hearts of WT sibling fish (F), grl5nt−/− fish (G), and injured ventricles from WT sibling fish (H), grl5nt−/− fish (I), 4-HT-treated Tg(cmlc2:nRSGG) control fish (J) and 4-HT-treated Tg(cmlc2:creER;cmlc2:nRSGG) animals (K) at 7 dpa, respectively (n=5). Brackets indicate injury site. Scale bars: 100 µm. |
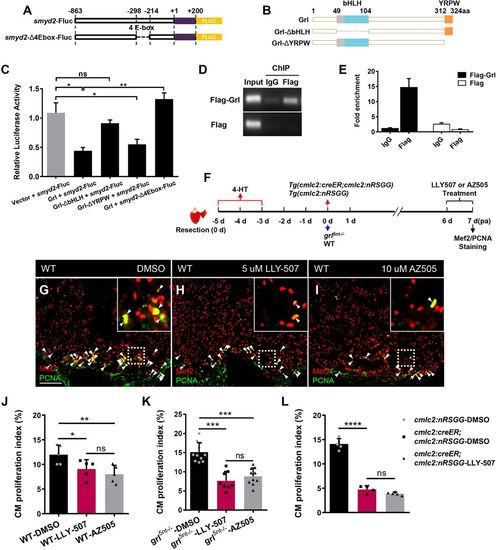
Smyd2 acts as a transcriptional target of Grl to promote heart regeneration. (A) E-box deletion in the smyd2 promoter for luciferase assays. (B) Deletion (Δ) fragments of Grl created for luciferase assays. (C) Luciferase activity in cells after co-transfection of pGL3-smyd2-Fluc with control plasmid vector, Grl, Grl-ΔbHLH or Grl-ΔYRPW expression plasmids, as well as transfection of pGL3-smyd2-Δ4Ebox-Fluc with Grl expression plasmids. The relative flyfire luciferase activity was normalized by Renilla luciferase and calculated as the ratio of each experimental group to the control group (n=3). (D,E) ChIP-PCR (D) and ChIP-qPCR (E) analyses of enrichment of Grl at its predicted binding sites in smyd2 promoter in HEK 293T cell. Enrichment levels of smyd2 promoter fragment were examined in pEGFP-Flag-grl and pEGFP-Flag transfected groups immunoprecipitated with anti-IgG or anti-Flag antibody. Genomic DNA isolated before IP was analyzed as the input control. Enrichment levels of qPCR analysis were normalized to that in the pEGFP-Flag-grl transfected group immunoprecipitated with IgG. (F) Experimental design for inhibitor treatment and CM proliferation analyses after ventricular resection in WT, grl mutant hearts, as well as in 4-HT-treated Tg(cmlc2;CreER;cmlc2:nRSGG) hearts and 4-HT-treated Tg(cmlc2;nRSGG) control hearts. Treatment at 6-7 dpa was with 5 µM LLY-507, 10 µM AZ505 or 0.5‰ DMSO. Red arrows represent experimental steps for Tg(cmlc2:creER;cmlc2:nRSGG) animals and Tg(cmlc2:nRSGG) control fish. Blue arrows represent experimental steps for grl5nt−/− mutant fish and WT sibling fish. (G-I) Immunofluorescent section images of injured ventricles from DMSO- (G), LLY-507- (H) and AZ505-treated (I) WT fish at 7 dpa, stained with anti-PCNA (green) and anti-Mef2 (red) antibodies. Insets show higher-magnification images of the dashed boxes. Arrowheads indicate proliferating CMs. (J) Quantification of CM proliferation indices in 7 dpa ventricles derived from DMSO-, LLY-507- or AZ505-treated WT fish (n=5). (K) Quantification of CM proliferation indices in 7 dpa ventricles derived from DMSO- (n=11), LLY-507- (n=8) or AZ505-treated grl5nt−/− fish (n=10). (L) Quantification of CM proliferation indices in 7 dpa ventricles derived from DMSO-treated Tg(cmlc2:nRSGG) control fish (n=5), DMSO-treated Tg(cmlc2:creER;cmlc2:nRSGG) fish (n=4) and LLY-507-treated Tg(cmlc2:creER;cmlc2:nRSGG) fish (n=5). Data presents as mean±s.e.m. *P<0.05, **P<0.01, ***P<0.001, ****P<0.0001, Student's t-test (unpaired, two-tailed). Scale bars: 100 µm. PHENOTYPE:
|
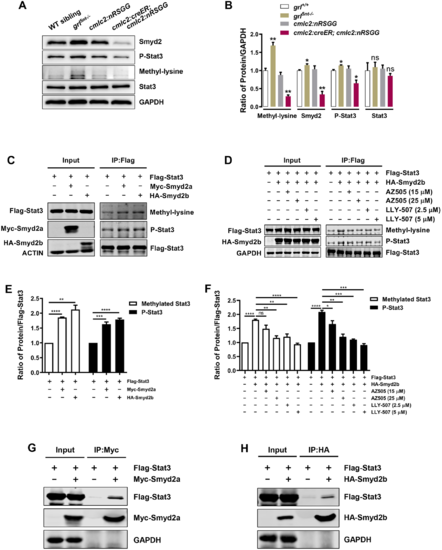
Smyd2 functions as a KMT and controls Stat3 methylation and phosphorylation. (A) western blot analysis exhibiting Smyd2, Stat3, P-Stat3 or corresponding lysine methylated proteins using total lysates extracted from WT sibling, grl5nt−/−, 4-HT-treated control Tg(cmlc2:nRSGG) hearts or 4-HT-treated Tg(cmlc2:creER;cmlc2:nRSGG) hearts at 7 dpa, respectively. GAPDH was used as a loading control. (B) Quantification of western blots using ImageJ software and normalized to GAPDH (n=3). (C) Methylation and phosphorylation assay showing increased levels of methylated Stat3 and P-Stat3 in Flag-Stat3 and Myc-Smyd2a/HA-Smyd2b co-transfected HEK 293T cells. The cell lysates were used to immunoprecipitate (IP) Stat3 with anti-Flag antibody and then blotted with anti-methyl-lysine or anti-P-Stat3 antibodies. (D) Treatment with AZ505 or LLY-507 diminishes Stat3 methylation and phosphorylation in cells co-transfected with Flag-Stat3 and HA-Smyd2b. The cell lysates were treated with AZ505 (15 µM for 6 h, 25 µM for 6 h) or LLY-507 (2.5 µM for 28 h, 5 µM for 28 h), used to IP Stat3 using anti-Flag antibody and then blotted with anti-methyl-lysine and anti-P-Stat3 antibodies. (E) Quantification of methylated Stat3 and phosphorylated Stat3 levels normalized to Flag-Stat3 (n=3). (F) Quantification of methylated Stat3 and phosphorylated Stat3 levels normalized to Flag-Stat3 in cells treated with AZ505 or LLY-507 (n=3). (G,H) Smyd2a or Smyd2b immunoprecipitation with anti-Myc antibody (G) or anti-HA antibody (H), respectively, detects Stat3 using anti-Flag antibody. HEK 293T cells were co-transfected with constructs of Flag-Stat3 and Myc-Smyd2a (G) or HA-Smyd2b (H). GAPDH was used as a loading control. Data represents mean±s.e.m. *P<0.05, **P<0.01, ***P<0.001, ****P<0.0001, Student's t-test (unpaired, two-tailed). |

Grl-Smyd2 mediates Stat3 activation during heart regeneration. (A-D) Immunofluorescent images of injured ventricles stained with anti-P-Stat3 antibody (green) and anti-Mef2 antibody (red) from WT siblings (A), grl5nt−/− mutant fish (B), 4-HT-treated Tg(cmlc2:nRSGG) control animals (C) and 4-HT-treated Tg(cmlc2:creER;cmlc2:nRGG) animals (D) at 7 dpa. Insets show higher-magnification images of the dashed boxes. Arrowheads indicate P-Stat3 overlapping with Mef2 in CM nuclei; Arrows indicate perinuclear cytosolic P-Stat3 around Mef2 nuclei. P-Stat3 immunostaining was also detectable in non-CM cells in the injured area. (E) Quantification of number of P-Stat3-positive CMs in the injury border zone of 7 dpa ventricles from WT siblings (n=5), grl5nt−/− mutants (n=4), Tg(cmlc2:nRSGG) control fish (n=5), or Tg(cmlc2:creER;cmlc2:nRGG) fish (n=6). (F-H) Immunofluorescent section images of injured ventricles stained with anti-P-Stat3 antibody (green) and anti-Mef2 antibody (red) from DMSO-treated (F), AZ505-treated (G) and LLY-507-treated grl5nt−/− mutant fish (H) at 7 dpa. Insets show higher-magnification images of the dashed boxes. Arrowheads indicate P-Stat3 overlapping with Mef2; Arrows indicate perinuclear cytosolic P-Stat3 around Mef2 nuclei. (I) Quantification of number of P-Stat3-positive CMs in injury border zones at 7 dpa from DMSO-treated (n=6), AZ505-treated (n=4) and LLY-507-treated grl5nt−/− mutant fish (n=4). (J) qPCR analyses of bcl2a, ccnd1 and socs3b in injured hearts extracted from Tg(cmlc2:creER;cmlc2:nRSGG) and Tg(cmlc2:nRSGG) control fish, as well as WT sibling and grl5nt−/− mutant fish (n=3). Data presents as mean±s.e.m. **P<0.01, ***P<0.001, ****P<0.0001, Student's t-test (unpaired, two-tailed). Scale bars: 100 µm. |