
|
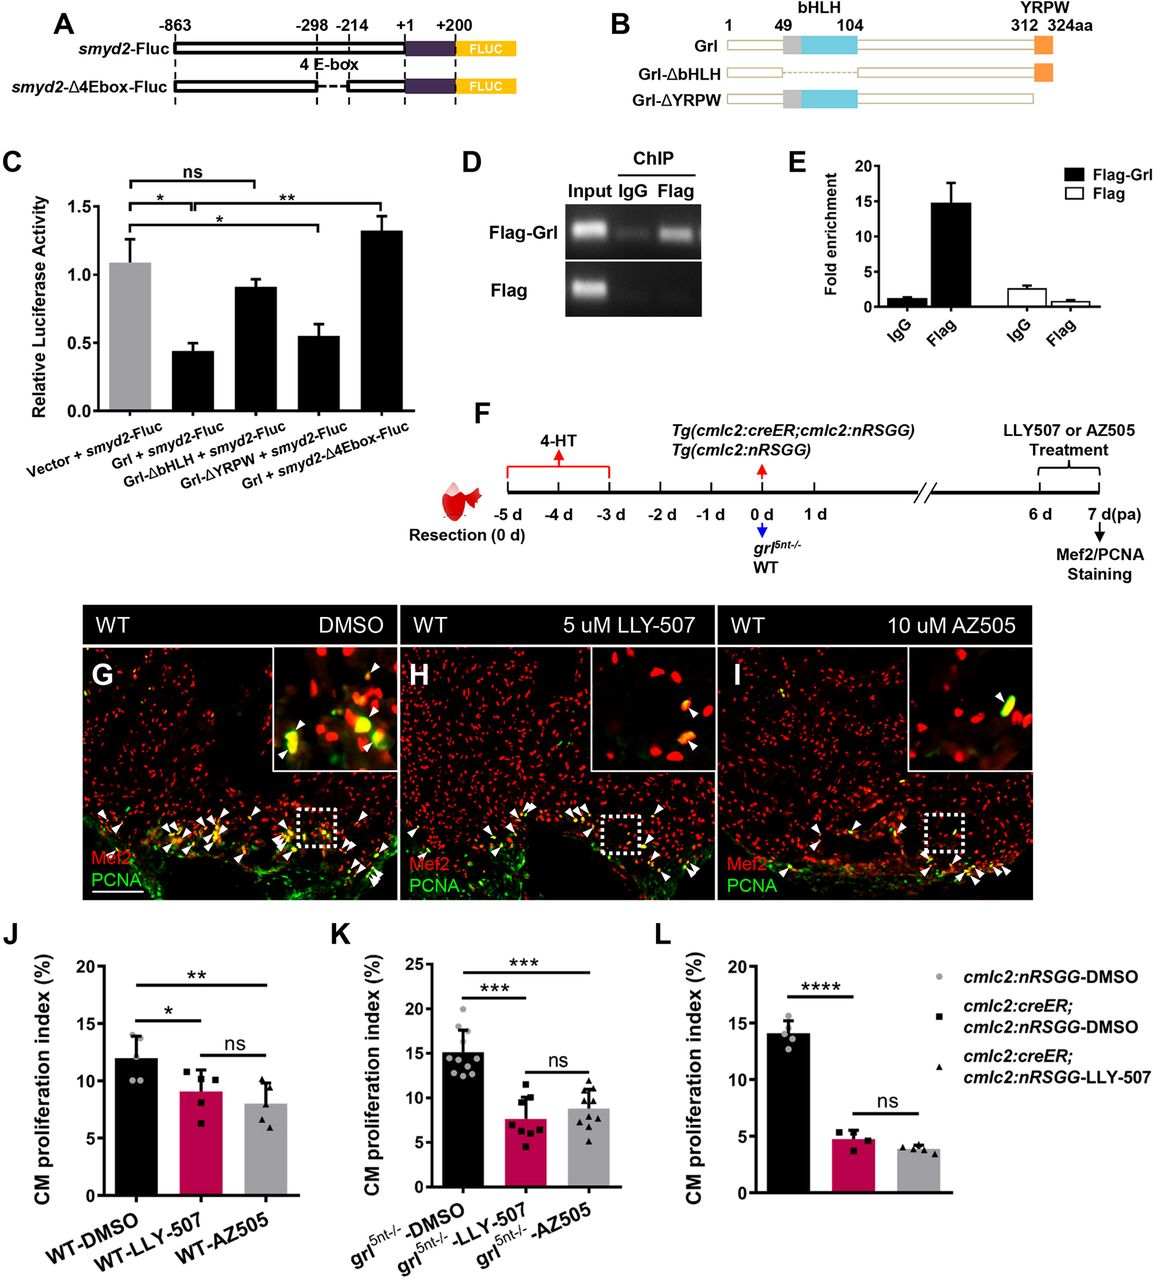
Fig. 5 Smyd2 acts as a transcriptional target of Grl to promote heart regeneration. (A) E-box deletion in the smyd2 promoter for luciferase assays. (B) Deletion (Δ) fragments of Grl created for luciferase assays. (C) Luciferase activity in cells after co-transfection of pGL3-smyd2-Fluc with control plasmid vector, Grl, Grl-ΔbHLH or Grl-ΔYRPW expression plasmids, as well as transfection of pGL3-smyd2-Δ4Ebox-Fluc with Grl expression plasmids. The relative flyfire luciferase activity was normalized by Renilla luciferase and calculated as the ratio of each experimental group to the control group (n=3). (D,E) ChIP-PCR (D) and ChIP-qPCR (E) analyses of enrichment of Grl at its predicted binding sites in smyd2 promoter in HEK 293T cell. Enrichment levels of smyd2 promoter fragment were examined in pEGFP-Flag-grl and pEGFP-Flag transfected groups immunoprecipitated with anti-IgG or anti-Flag antibody. Genomic DNA isolated before IP was analyzed as the input control. Enrichment levels of qPCR analysis were normalized to that in the pEGFP-Flag-grl transfected group immunoprecipitated with IgG. (F) Experimental design for inhibitor treatment and CM proliferation analyses after ventricular resection in WT, grl mutant hearts, as well as in 4-HT-treated Tg(cmlc2;CreER;cmlc2:nRSGG) hearts and 4-HT-treated Tg(cmlc2;nRSGG) control hearts. Treatment at 6-7 dpa was with 5 µM LLY-507, 10 µM AZ505 or 0.5‰ DMSO. Red arrows represent experimental steps for Tg(cmlc2:creER;cmlc2:nRSGG) animals and Tg(cmlc2:nRSGG) control fish. Blue arrows represent experimental steps for grl5nt−/− mutant fish and WT sibling fish. (G-I) Immunofluorescent section images of injured ventricles from DMSO- (G), LLY-507- (H) and AZ505-treated (I) WT fish at 7 dpa, stained with anti-PCNA (green) and anti-Mef2 (red) antibodies. Insets show higher-magnification images of the dashed boxes. Arrowheads indicate proliferating CMs. (J) Quantification of CM proliferation indices in 7 dpa ventricles derived from DMSO-, LLY-507- or AZ505-treated WT fish (n=5). (K) Quantification of CM proliferation indices in 7 dpa ventricles derived from DMSO- (n=11), LLY-507- (n=8) or AZ505-treated grl5nt−/− fish (n=10). (L) Quantification of CM proliferation indices in 7 dpa ventricles derived from DMSO-treated Tg(cmlc2:nRSGG) control fish (n=5), DMSO-treated Tg(cmlc2:creER;cmlc2:nRSGG) fish (n=4) and LLY-507-treated Tg(cmlc2:creER;cmlc2:nRSGG) fish (n=5). Data presents as mean±s.e.m. *P<0.05, **P<0.01, ***P<0.001, ****P<0.0001, Student's t-test (unpaired, two-tailed). Scale bars: 100 µm.