
Fig. 4
|
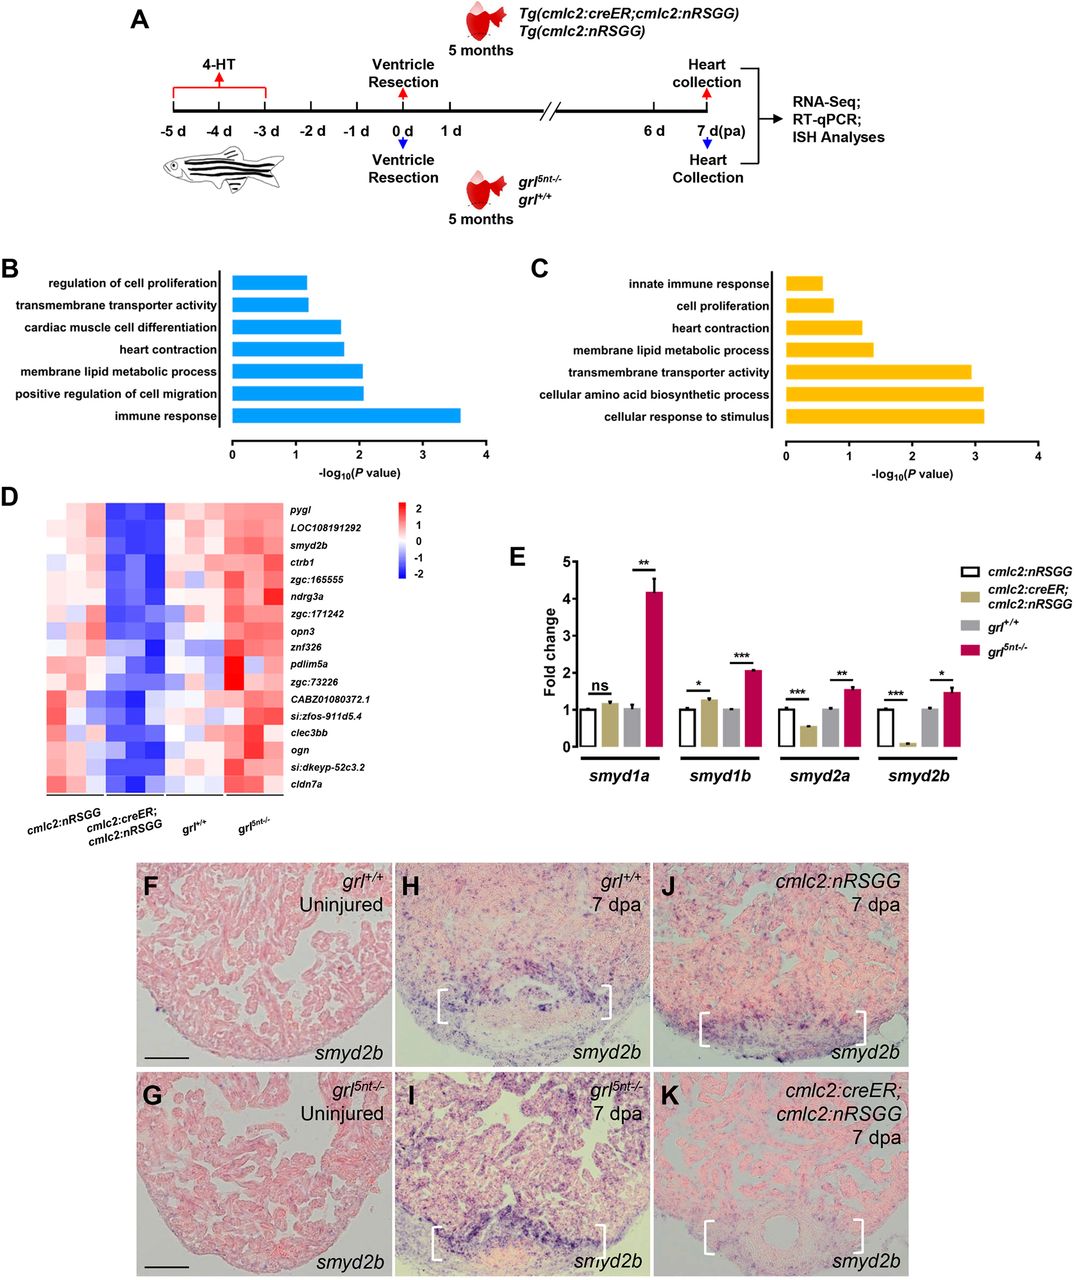
Fig. 4 Identification of Smyd2 methyltransferase as candidate Grl target in the regenerating heart. (A) Experimental design for RNA-seq, RT-qPCR and ISH analyses. Red arrows represent experimental steps for Tg(cmlc2:creER;cmlc2:nRSGG) animals and Tg(cmlc2:nRSGG) control fish. Blue arrows represent experimental steps for grl5nt−/− mutant fish and WT sibling fish. (B,C) Bar graph showing −log10 P values for GO terms significantly represented in the downregulated gene category of the grl-overexpressing groups (B) and in the upregulated gene category of the grl mutant groups (C). (D) Heatmap indicating genes downregulated in Tg(cmlc2:creER;cmlc2:nRSGG) hearts and upregulated in grl5nt−/− mutant hearts after resection, compared with control wounded hearts. Red, higher expression; blue, lower expression. FC>1.5, P<0.05. (E) qPCR analyses of smyd1a, smyd1b, smyd2a and smyd2b in injured hearts extracted from Tg(cmlc2:creER;cmlc2:nRSGG), Tg(cmlc2:nRSGG), grl5nt−/− and grl+/+ animals. Data presents as mean±s.e.m. (n=3); *P<0.05, **P<0.01, ***P<0.001, Student's t-test (unpaired, two-tailed). (F-K) ISH analyses of smyd2b expression in uninjured hearts of WT sibling fish (F), grl5nt−/− fish (G), and injured ventricles from WT sibling fish (H), grl5nt−/− fish (I), 4-HT-treated Tg(cmlc2:nRSGG) control fish (J) and 4-HT-treated Tg(cmlc2:creER;cmlc2:nRSGG) animals (K) at 7 dpa, respectively (n=5). Brackets indicate injury site. Scale bars: 100 µm.