
- Title
-
GlyR autoantibodies impair receptor function and induce motor dysfunction
- Authors
- Rauschenberger, V., Wardenburg, N.V., Schaefer, N., Ogino, K., Hirata, H., Lillesaar, C., Kluck, C.J., Meinck, H.M., Borrmann, M., Weishaupt, A., Doppler, K., Wickel, J., Geis, C., Sommer, C., Villmann, C.
- Source
- Full text @ Ann. Neurol.

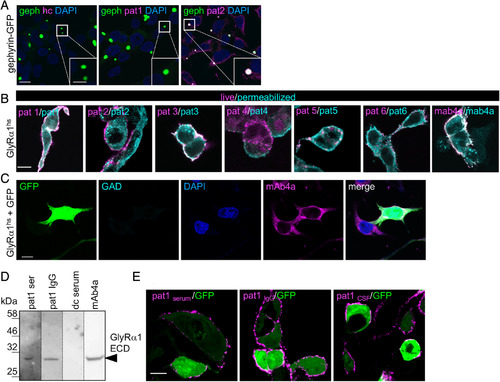
GlyR‐autoantibodies bind to native and denatured receptor protein. (A) HEK293 cells transfected with a fusion protein of gephyrin and green fluorescent protein (geph‐GFP, green) were stained with healthy control serum (hc), serum of Patient 1 (pat1), and serum of pat2. Intensive colocalization of targeted gephyrin by pat2 autoantibodies and geph‐GFP in the GFP blobs within the cell (see magnified inset, white bar in inset represents 5μm). Positive gephyrin labeling (pink) was also observed in the intracellular part of the cell. Nuclei were marked by 4,6‐diamidino‐2‐phenylindole (DAPI; blue). (B) Transfected HEK293 cells with GlyRα1hs were used. MAb4a (GlyRα1hs fixed and permeabilized) was used to detect GlyRα subunits and served as positive control (right image). Serum GlyR‐autoantibodies from all patients bind to native (magenta) and denatured (cyan) epitopes of GlyRα1hs. (C) Cells were transfected with GFP (green) and GlyRα1hs and stained with glutamic acid decarboxylase (GAD)‐positive control serum (cyan) and the pan‐GlyR antibody mAb4a (pink). Nuclei were marked by DAPI (blue). Scale bars in A–C represent 10μm. (D) The human GlyRα1 extracellular domain (ECD; residues 1–219 = 30.68kDa) was loaded (10μg each lane). The serum of pat1 and the pat1 IgG detected the GlyRα1 ECD similar to the monoclonal antibody mAb4a (pan‐GlyR). dc = disease control, which served as negative control. (E) GlyRα1hs and GFP cotransfected HEK293 cells were incubated with pat1 serum, pat1 purified IgG, and pat1 cerebrospinal fluid (CSF). Magenta fluorescent signals correspond to GlyRα1 bound by the antibodies used. Scale bar = 20μm. |
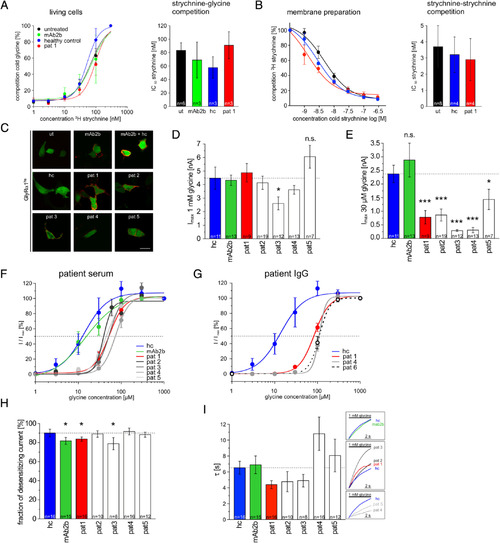
Autoantibody binding does not impair glycine binding to the orthosteric glycine binding site but affects glycine potency. Ligand binding was tested using living HEK293 cells (A) and membrane preparations from transfected HEK293 cells with GlyRα1hs (B). (A) Living cells were preincubated with mAb2b (green), serum of Patient 1 (pat1; red), or a healthy control (hc; blue) followed by incubation with a saturating concentration of glycine (30mM) and competed with an increasing strychnine concentration series (1, 3, 10, 30, 100, 300nM). Untreated cells were used as control (black). Bar diagram indicates determination of strychnine IC50 (nM). (B) Membrane preparations of GlyRα1hs transfected cells were used and preincubated with hc or pat1 serum; untreated (ut) membrane preparations served as control. Strychnine–strychnine competition was done using decreasing concentrations of cold strychnine (1,000, 300, 100, 30, 10, 3, 1nM), which were replaced by a fixed strychnine concentration (3nM, 3H strychnine). Bar diagram indicates quantification of the strychnine IC50 values obtained under different preincubation conditions. (C‐I) Electrophysiological whole‐cell recordings were done from GlyRα1hs transfected cells subsequent to 1‐hour preincubation of with either hc serum (blue bar), mAb2b (green bar; monoclonal antibody), or different sera from Patients 1–5 (pat1 always shown with red color; white bars refer to other pat2–pat6; various gray colors for pat2–pat6 are used when lines are presented). (C) After recordings were completed, cells were stained with the secondary antihuman IgG Cy3 (except antimouse IgG for mAb2b Cy3) to verify autoantibody binding to transfected cells (magenta signal); green fluorescent protein was cotransfected (green fluorescent signal); untreated cells served as negative control. Green cells were used for whole‐cell recordings only. (D) Mean current values evoked by 1mM glycine following 1 hour of treatment with serum from pat1–pat5, with serum from hc (1:10), or with mAb2b (1:500). (E) Currents evoked by 30μM glycine were significantly reduced after treatment with all patient sera investigated. (F) Dose–response curves for the agonist glycine using a concentration series of 1, 3, 10, 30, 100, 300, and 1,000μM. Cells were preincubated for 1 hour with either mAb2b or serum from hc or pat1–pat5. Dotted line indicates half‐maximal responses (EC50). (G) Dose–response curves (same glycine concentrations as in F) following 1‐hour preincubation with purified IgG from pat1 (red line), pat4 (gray line), and pat6 (black dashed line). (H) Fraction of desensitizing currents following an application of the agonist glycine (1mM) for 10 second. (I) Desensitization time constant τ determined over a time period of 10 seconds. The normalized traces (right boxes) illustrate the representative desensitization behavior following incubation with different patient sera as indicated. Dotted lines in D, E and H, I refer to the control measurements with the hc serum. *p < 0.05, ***p < 0.001. ns = not significant. |
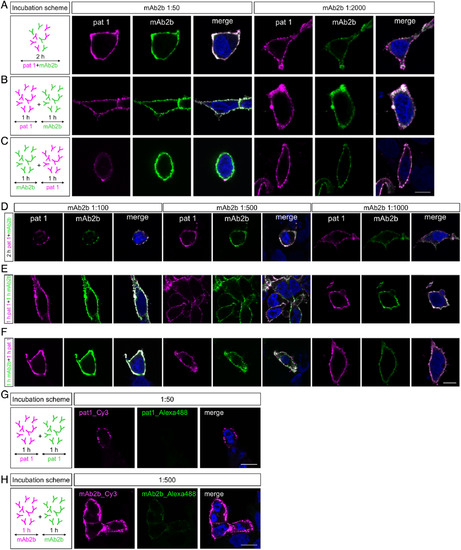
Patient serum does not compete with mAb2b for the same binding sites at the human GlyRα1 subunit. (A–C) Left images: Incubation schemes of Patient 1 (pat1) serum and mAb2b incubated either together for 2 hours or successively for 1 hour each. (A–C) Middle images: Fluorescence signals of GlyRα1hs transfected HEK293 cells incubated with pat1 serum (1:50) and mAb2b (1:50) using 3 different protocols. (A–C) Right images: Different antibody concentrations were used (pat1 serum 1:50 and mAb2b 1:2,000). (D–F) Fluorescence signals of GlyRα1hs transfected HEK293 cells incubated with pat1 serum (1:50) and mAb2b (1:100; 1:500; 1:1,000) together for 2 hours (D), successively first with pat1 serum for 1 hour followed by 1 hour with mAb2b (E), and successively first 1 hour with mAb2b followed by pat1 serum for 1 hour (F). (G) Cells were incubated with pat1 serum 1:50 twice. Following the first pat1 incubation, labeled protein was stained with secondary goat antihuman Cy3 (left). Pat1 serum was applied again for 1 hour and stained with goat antihuman Alexa Fluor 488 (middle). (H) Cells were incubated with mAb2b 1:500 followed by secondary staining with goat antimouse Cy3. mAb2b was applied again for 1 hour and stained with goat antimouse Alexa Fluor 488. Scale bars = 10μm. |
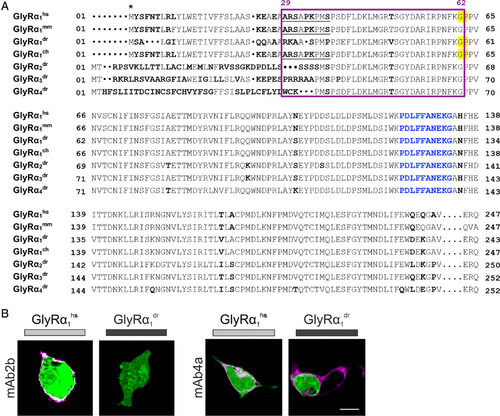
The far GlyR N‐terminus determines species specificity of GlyR autoantibodies. (A) Amino acid sequence alignment of the extracellular domains of the immature GlyRα1hs, GlyRα1mm, GlyRα1dr, GlyRα1ch, GlyRα2dr, GlyRα3dr, and GlyRα4dr. Deviations in amino acid alignment are displayed in bold letters. The epitope of the monoclonal antibody mAb2b (α1‐specific antibody recognizing residues 1–10 of the mature protein) is underlined; the epitope of mAb4a pan‐GlyR antibody (present in GlyRα1dr; GlyRα1hs and GlyRα1ch residues 96–105) is marked by blue letters. Start of protein is marked by an asterisk (signal peptide first 28 residues). Residues that refer to the site of the restriction enzyme PpuM I used to generate a chimera are shaded in yellow. The proposed epitope of GlyR autoantibodies is marked by a pink box. (B) HEK293 cells where cotransfected with green fluorescent protein (green) and GlyRα1dr. The mAb2b antibody binds only to GlyRα1hs but not to GlyRα1dr, whereas the pan‐GlyR antibody mAb4a binds both the human and the zebrafish α1 subunit. White bar = 10μm. ch = chimeric; dr = Danio rerio; hs = Homo sapiens; mm = Mus musculus. |
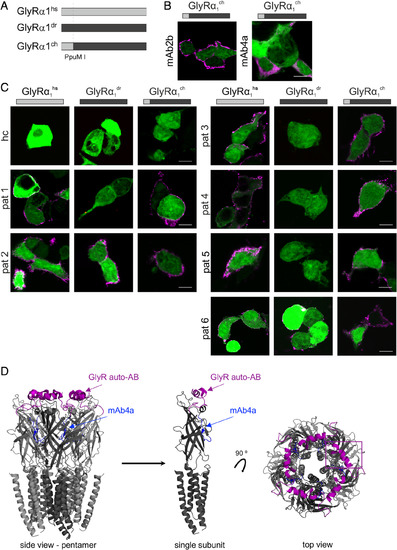
The GlyRα1 far N‐terminus represents a common epitope for GlyR autoantibodies. (A) Chimeric GlyRα1ch is composed of the N‐terminal part of GlyRα1hs (gray bar) and the C‐terminal part of GlyRα1dr (black bar). Cutting site is indicated by a vertical dotted line (PpuM I, Fig 4A). (B) HEK293 cells where cotransfected with green fluorescent protein (green) and either GlyRα1hs, GlyRα1dr, or GlyRα1ch. GlyRα1ch was detected by the pan‐GlyR antibody mAb4a and mAb2b. (C) Serum of Patient 1 (pat1), pat3, pat4, and pat5 refer to the same staining pattern as mAb2b. The serum from pat2 and pat6 stained all 3 GlyR variants: GlyRα1hs, GlyRα1dr, and GlyRα1ch. Serum from a healthy control served as negative control. White bars = 10μm. (D) Structural model of the GlyRα1 according to Du et al.19 Labeled are the proposed epitope for GlyR autoantibodies (pink) and the mAb4a epitope (blue). Left, pentamer; center, single subunit from side; right, top view on pentamer GlyR. Note the surface localization of the GlyR autoantibody epitope (pink) in contrast to the mAb4a epitope (blue) deeper in the structure at the interface between two adjacent subunits. ch = chimeric; dr = Danio rerio; hs = Homo sapiens. |
Zebrafish larvae show abnormal escape response and reduced spinal cord GlyR cluster numbers upon treatment with patient serum. (A) Transfected HEK293 cells with various GlyR subunits of the zebrafish (dr = Danio rerio; α1, α2, α3, α4a, α4b, βa, βb) stained with serum of Patient 1 (pat1; magenta). Green fluorescent protein (GFP; green) was cotransfected. 4,6‐Diamidino‐2‐phenylindole (DAPI) was used to stain the nuclei. Note that pat1 serum specifically targets GlyR α2 and α4a (magenta). To some extent, α4b and βa were also stained. White bar = 20μm. (B, C) Sequence photographs of escape responses to tactile stimulation. The tip of the steel needle is visible in the bottom corner of each image. Touching the larva is indicated as 0 milliseconds. (B) Escape response of a healthy control (hc) serum permeated larva (n = 42). ACSF = artificial cerebrospinal fluid. (C) Escape response of a pat1 serum permeated larva (n = 29). This larva showed a weak convulsion in response to stimulation and remained stiff instead of initiating swimming. Scale bars = 1mm. (D, E) Stacked bar diagrams representing the different conditions of permeated larvae with patient serum or patient IgG. Black bars refer to portion of normal escape response (see also cyan dotted line for differences between conditions), gray bars refer to mild affected escape response, and red bars refer to severe impaired escape behavior (see also blue dotted line). All values are given as percentages. Animals analyzed for control conditions were ASCF, n = 38; hc, n = 42; glutamic acid decarboxylase (GAD)+, n = 34; pat1, n = 29; pat2, n = 29; pat3, n = 45; pat4, n = 32; pat1 IgG, n = 43; pat4 IgG, n = 36. *p < 0.05, **p < 0.01, ***p < 0.001. (F) Immunostaining of glycinergic synapses (GlyR green). Antisynapsin1 antibody was used as primary antibody to detect presynaptic terminals (magenta); NucRed is shown in blue. Boxed areas in F are enlarged at the top right corners of the images showing staining in close proximity to the nucleus. (G) Immunostaining of glutamatergic synapses. Antisynaptic vesicle glycoprotein 2A (SV2) antibody was used as primary antibody to detect presynaptic terminals (magenta). α‐Amino‐3‐hydroxy‐5‐methyl‐4‐isoxazolepropionic acid receptors (AMPARs) were stained with anti‐GluR2/3 antibody (green) and DAPI (blue). Scale bar = 5μm. (H, I) Relative number of GlyR clusters and AMPAR clusters following injection of the zebrafish with hc (blue) or pat1 serum (red) as compared to ACSF controls (black columns). **p < 0.01. ns = not significant. |
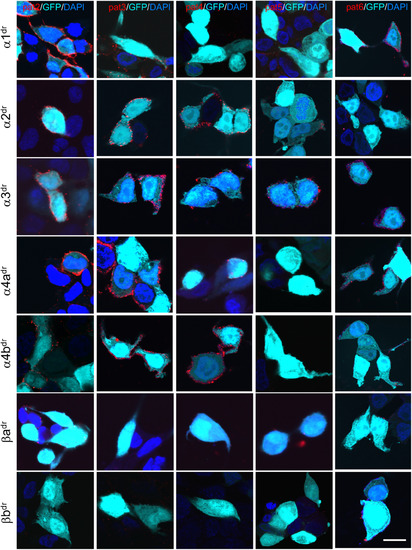
All patient sera target some GlyR subunits of the zebrafish. HEK293 cells cotransfected with green fluorescent protein (GFP; cyan) and GlyR subunits of Danio rerio (dr; α1, α2, α3, α4a, α4b, βa and βb) were stained with sera from Patient 2 (pat2), pat3, pat4, pat5, and pat6 (red). 4,6‐Diamidino‐2‐phenylindole (DAPI) (blue) labeled the nucleus. White bar in right column represents 20μm. Note that most patient sera target α2, α3, and α4a. The β subunits of D. rerio do not represent a common target for the human GlyR autoantibodies. Stainings for the β subunits were performed following permeabilization of the cells, because the β subunits are not transported to the surface without the presence of α subunits. |