
|
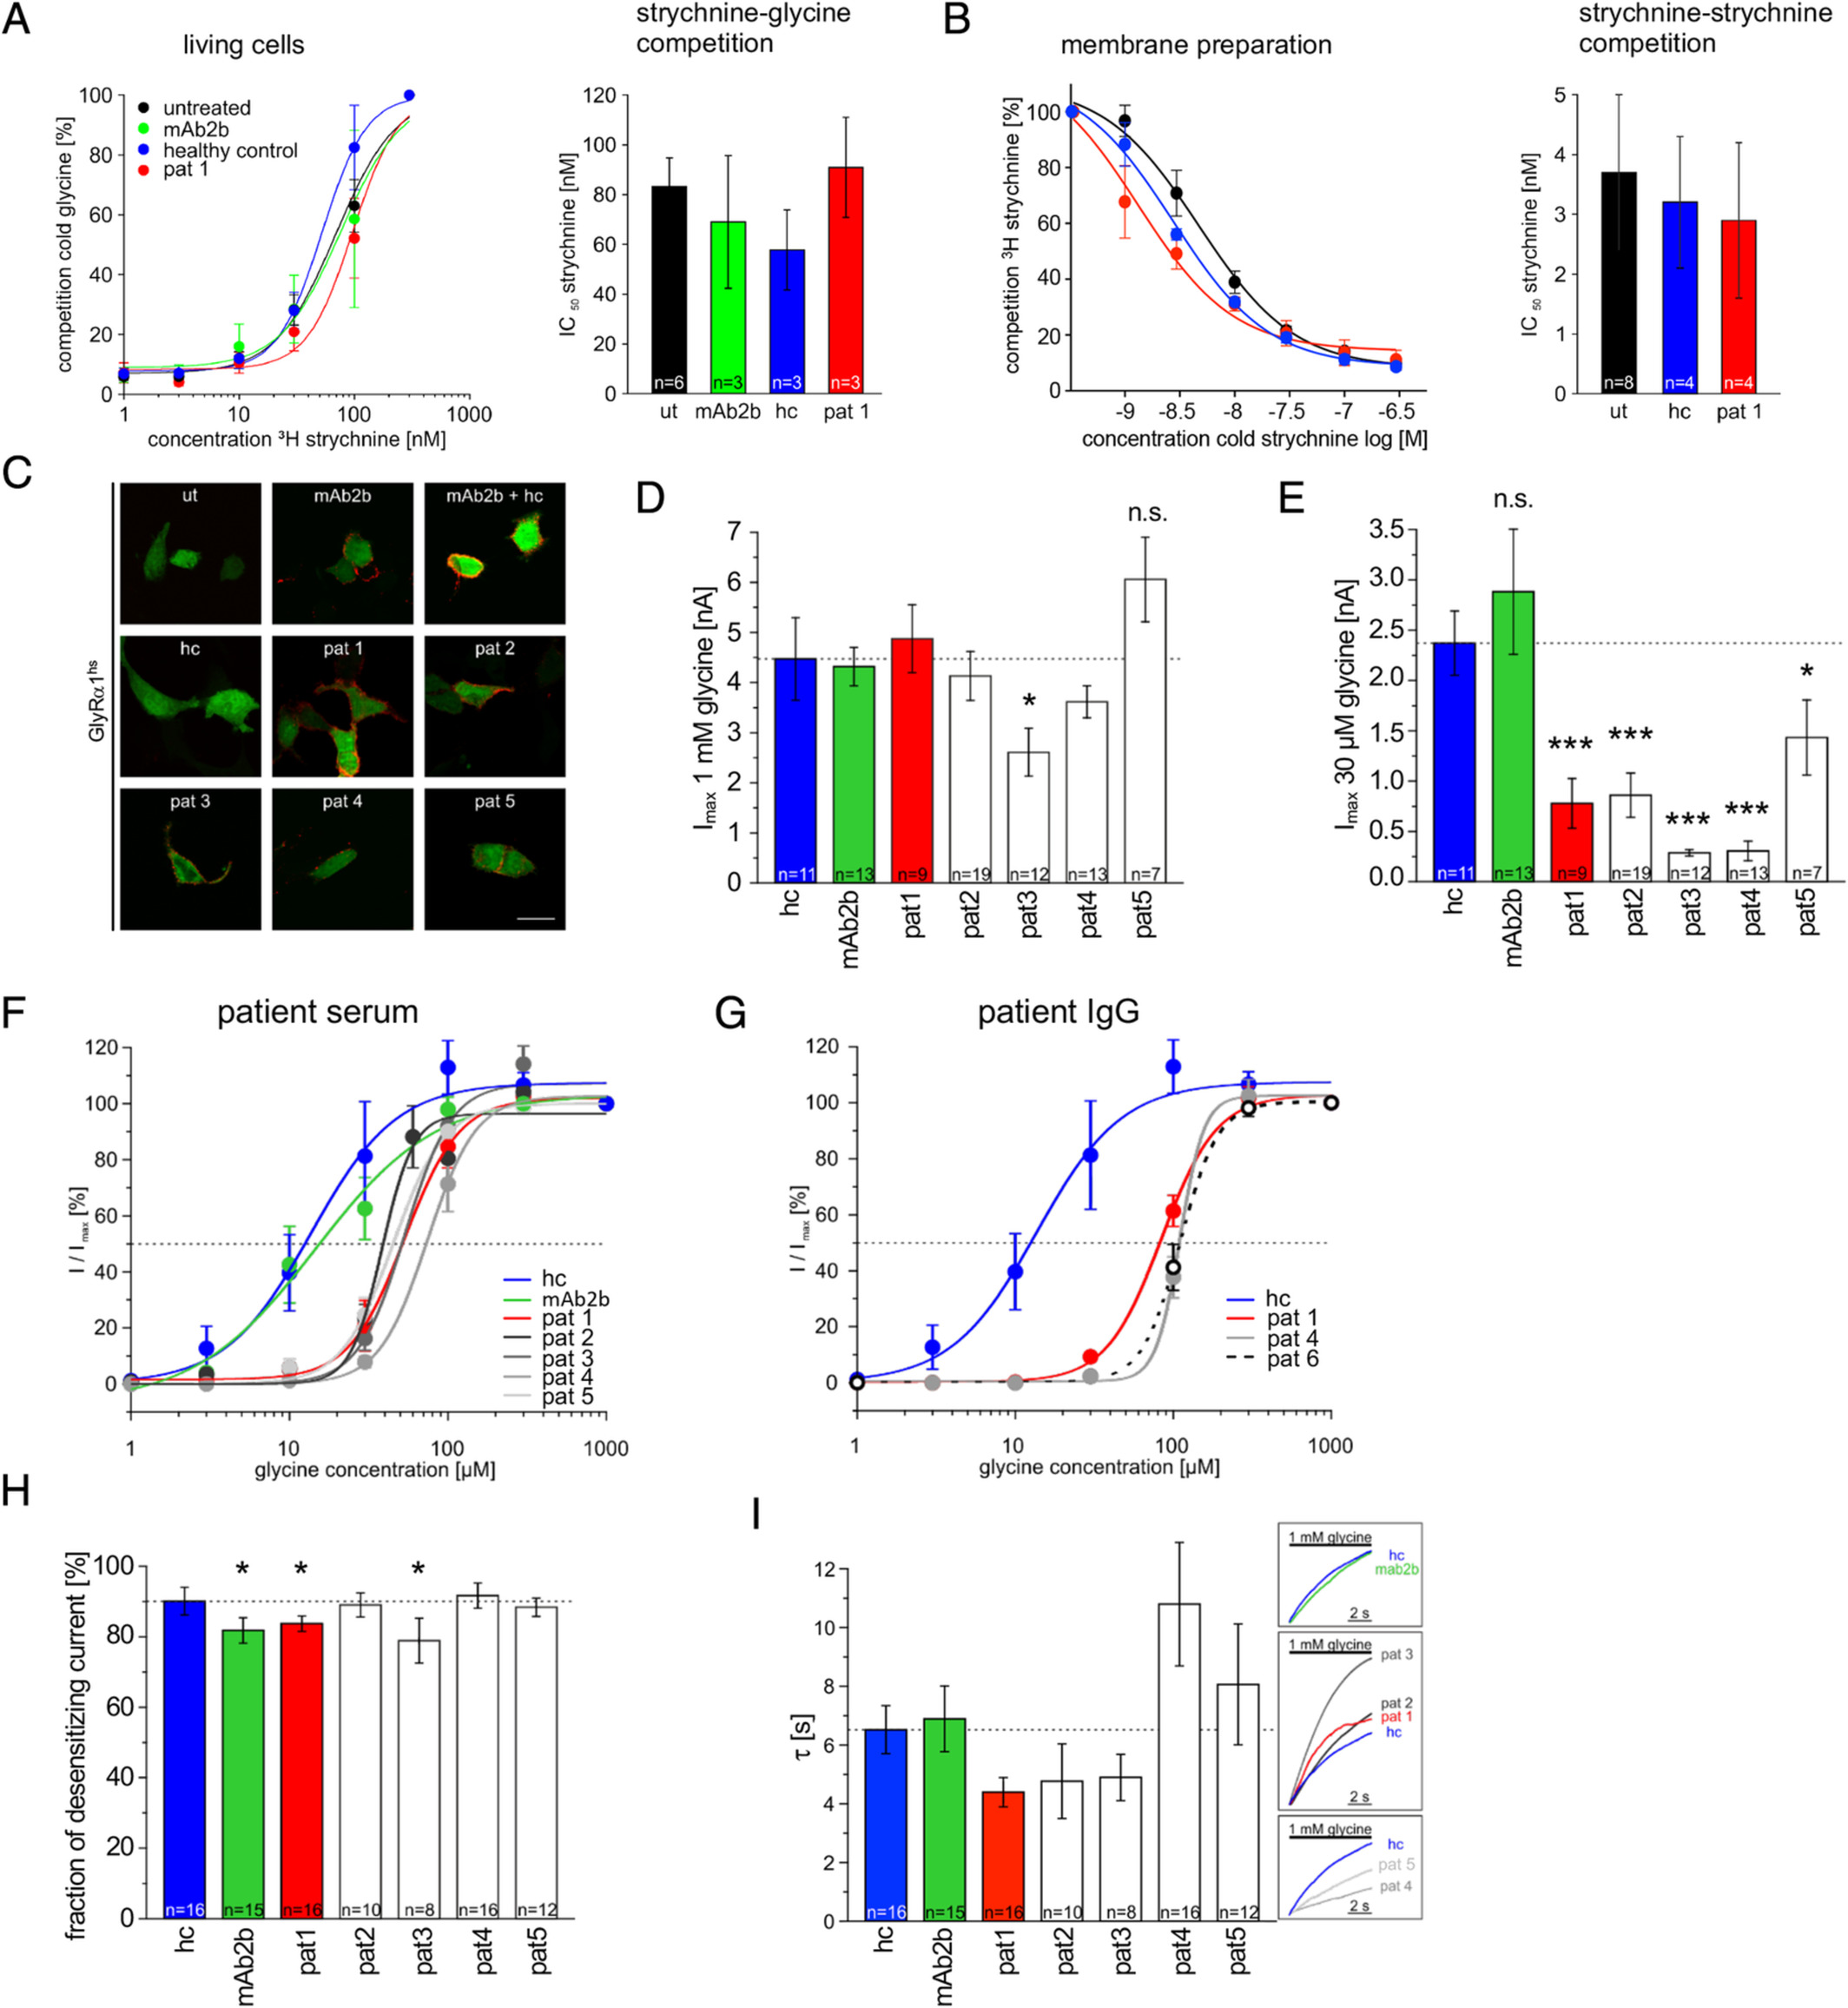
Fig. 2 Autoantibody binding does not impair glycine binding to the orthosteric glycine binding site but affects glycine potency. Ligand binding was tested using living HEK293 cells (A) and membrane preparations from transfected HEK293 cells with GlyRα1hs (B). (A) Living cells were preincubated with mAb2b (green), serum of Patient 1 (pat1; red), or a healthy control (hc; blue) followed by incubation with a saturating concentration of glycine (30mM) and competed with an increasing strychnine concentration series (1, 3, 10, 30, 100, 300nM). Untreated cells were used as control (black). Bar diagram indicates determination of strychnine IC50 (nM). (B) Membrane preparations of GlyRα1hs transfected cells were used and preincubated with hc or pat1 serum; untreated (ut) membrane preparations served as control. Strychnine–strychnine competition was done using decreasing concentrations of cold strychnine (1,000, 300, 100, 30, 10, 3, 1nM), which were replaced by a fixed strychnine concentration (3nM, 3H strychnine). Bar diagram indicates quantification of the strychnine IC50 values obtained under different preincubation conditions. (C‐I) Electrophysiological whole‐cell recordings were done from GlyRα1hs transfected cells subsequent to 1‐hour preincubation of with either hc serum (blue bar), mAb2b (green bar; monoclonal antibody), or different sera from Patients 1–5 (pat1 always shown with red color; white bars refer to other pat2–pat6; various gray colors for pat2–pat6 are used when lines are presented). (C) After recordings were completed, cells were stained with the secondary antihuman IgG Cy3 (except antimouse IgG for mAb2b Cy3) to verify autoantibody binding to transfected cells (magenta signal); green fluorescent protein was cotransfected (green fluorescent signal); untreated cells served as negative control. Green cells were used for whole‐cell recordings only. (D) Mean current values evoked by 1mM glycine following 1 hour of treatment with serum from pat1–pat5, with serum from hc (1:10), or with mAb2b (1:500). (E) Currents evoked by 30μM glycine were significantly reduced after treatment with all patient sera investigated. (F) Dose–response curves for the agonist glycine using a concentration series of 1, 3, 10, 30, 100, 300, and 1,000μM. Cells were preincubated for 1 hour with either mAb2b or serum from hc or pat1–pat5. Dotted line indicates half‐maximal responses (EC50). (G) Dose–response curves (same glycine concentrations as in F) following 1‐hour preincubation with purified IgG from pat1 (red line), pat4 (gray line), and pat6 (black dashed line). (H) Fraction of desensitizing currents following an application of the agonist glycine (1mM) for 10 second. (I) Desensitization time constant τ determined over a time period of 10 seconds. The normalized traces (right boxes) illustrate the representative desensitization behavior following incubation with different patient sera as indicated. Dotted lines in D, E and H, I refer to the control measurements with the hc serum. *p < 0.05, ***p < 0.001. ns = not significant.