
|
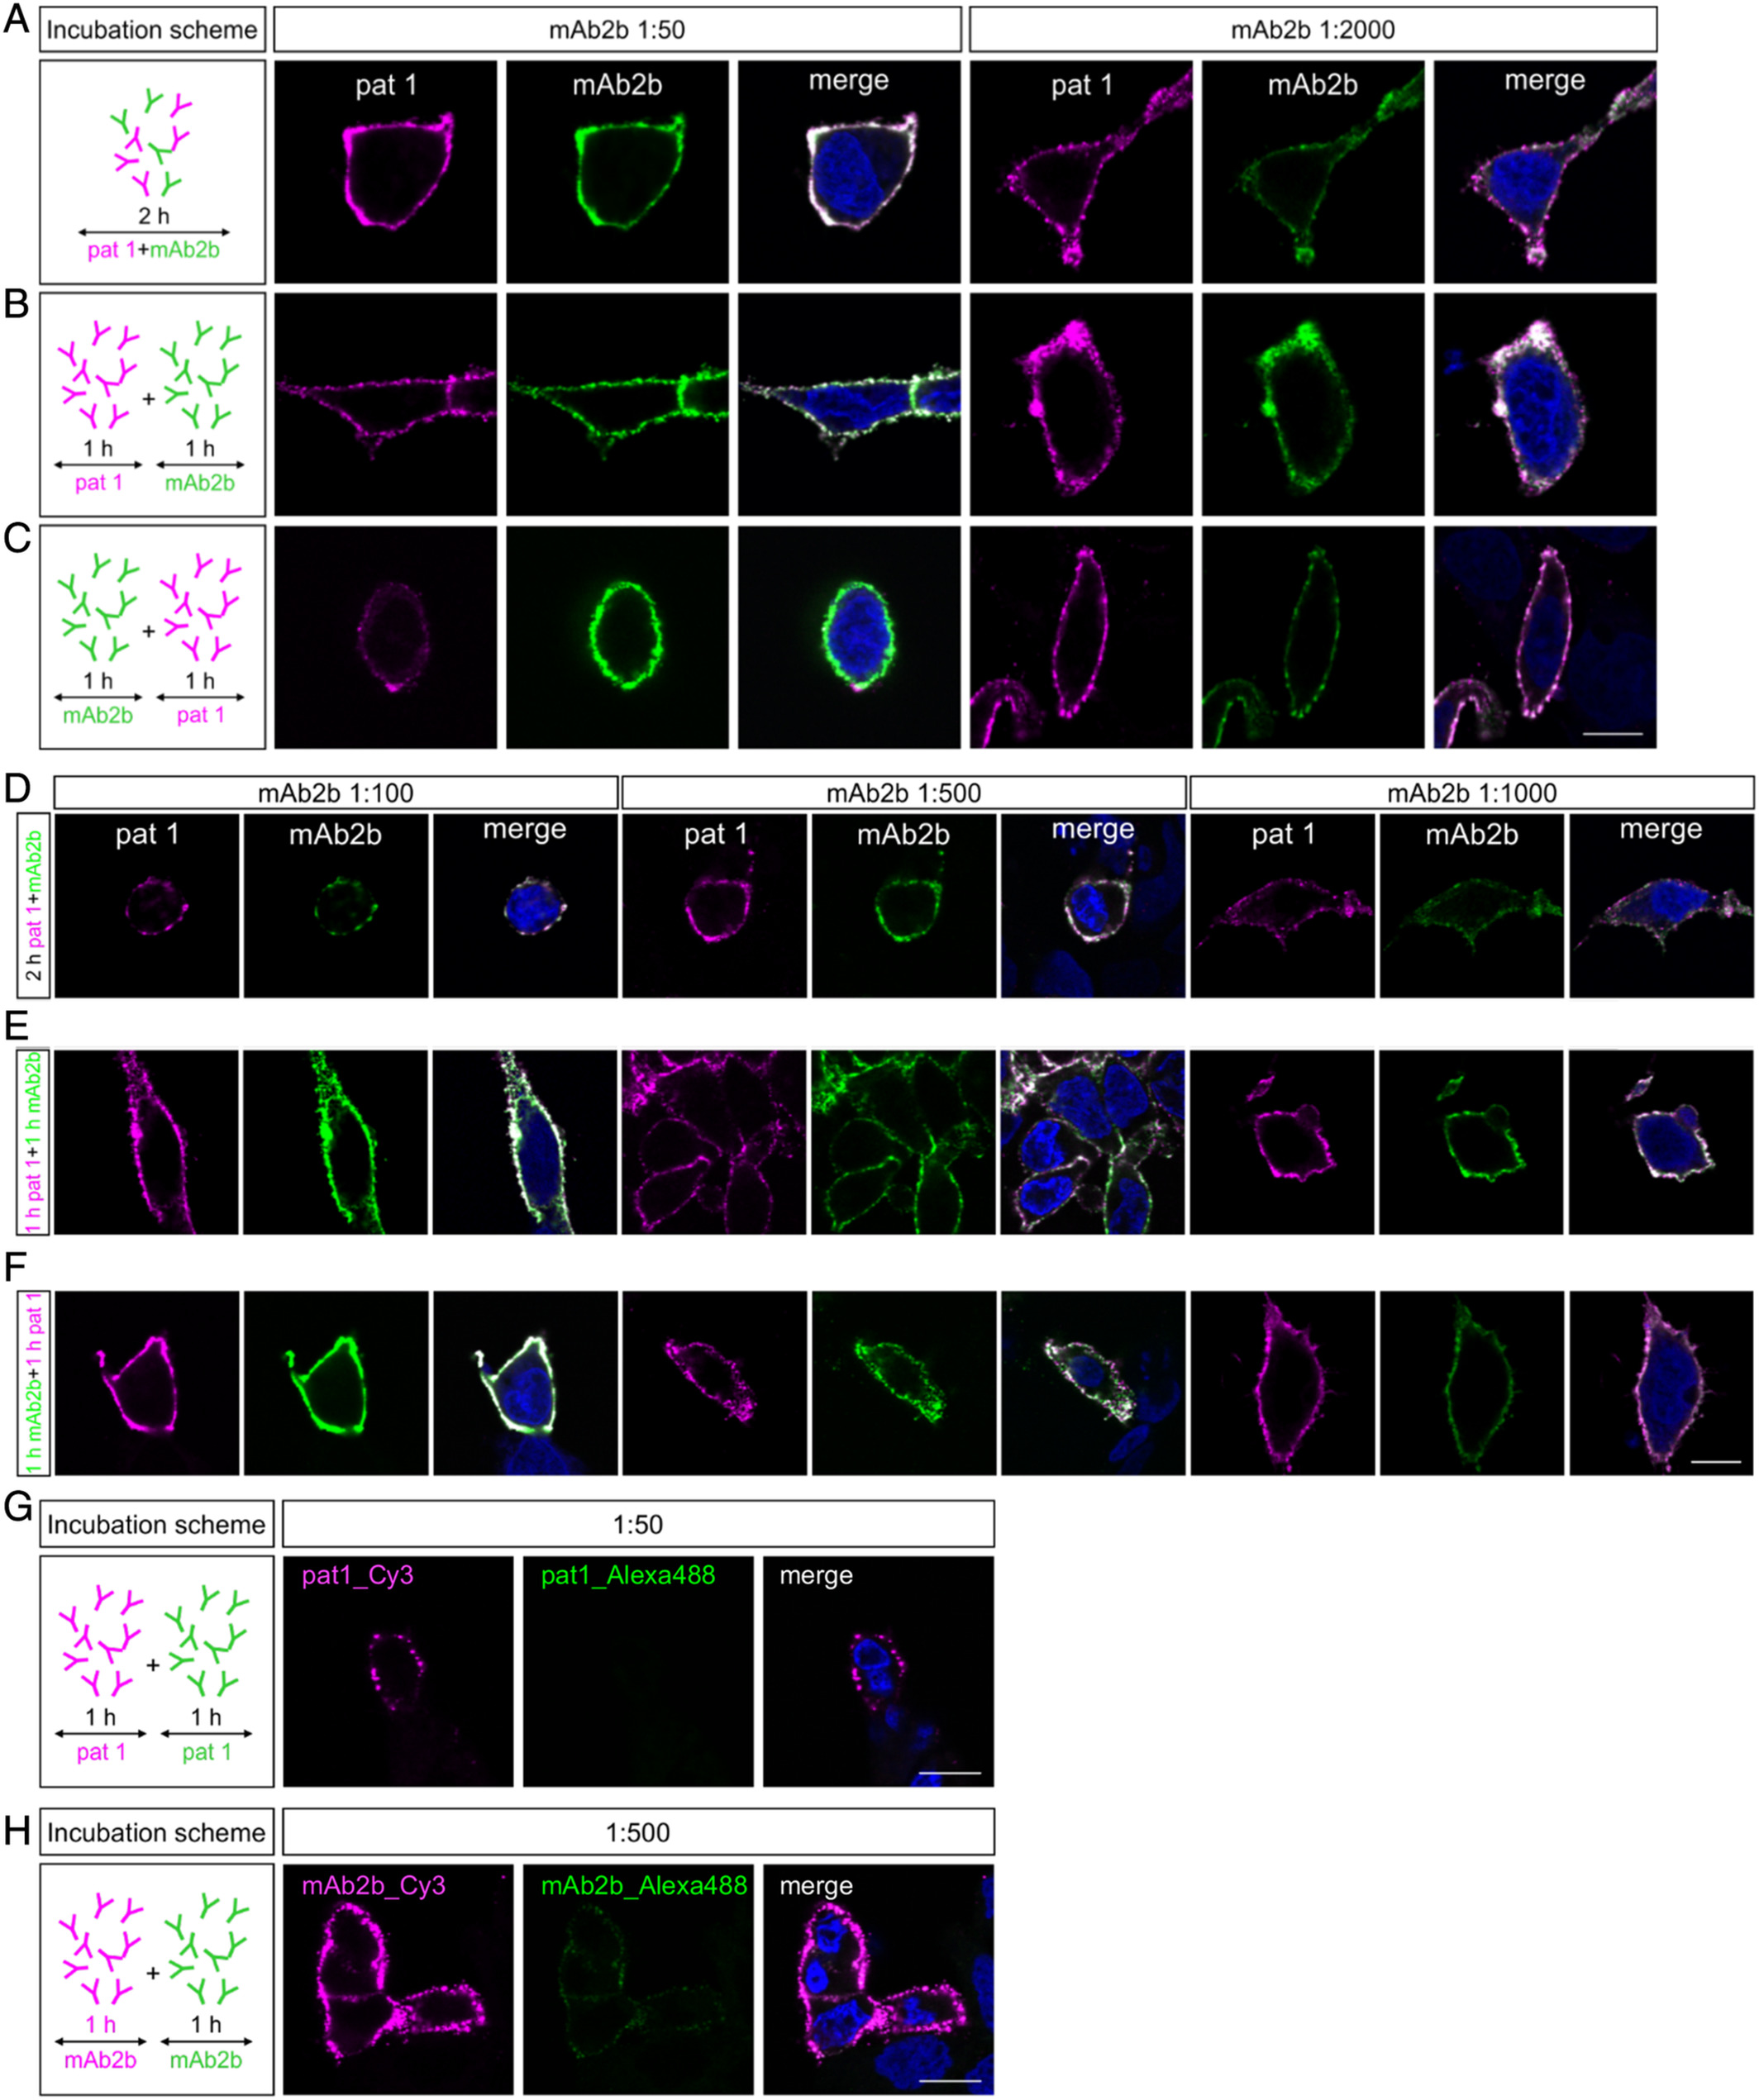
Fig. 3 Patient serum does not compete with mAb2b for the same binding sites at the human GlyRα1 subunit. (A–C) Left images: Incubation schemes of Patient 1 (pat1) serum and mAb2b incubated either together for 2 hours or successively for 1 hour each. (A–C) Middle images: Fluorescence signals of GlyRα1hs transfected HEK293 cells incubated with pat1 serum (1:50) and mAb2b (1:50) using 3 different protocols. (A–C) Right images: Different antibody concentrations were used (pat1 serum 1:50 and mAb2b 1:2,000). (D–F) Fluorescence signals of GlyRα1hs transfected HEK293 cells incubated with pat1 serum (1:50) and mAb2b (1:100; 1:500; 1:1,000) together for 2 hours (D), successively first with pat1 serum for 1 hour followed by 1 hour with mAb2b (E), and successively first 1 hour with mAb2b followed by pat1 serum for 1 hour (F). (G) Cells were incubated with pat1 serum 1:50 twice. Following the first pat1 incubation, labeled protein was stained with secondary goat antihuman Cy3 (left). Pat1 serum was applied again for 1 hour and stained with goat antihuman Alexa Fluor 488 (middle). (H) Cells were incubated with mAb2b 1:500 followed by secondary staining with goat antimouse Cy3. mAb2b was applied again for 1 hour and stained with goat antimouse Alexa Fluor 488. Scale bars = 10μm.