FIGURE SUMMARY
Title

Low Molecular Weight Fucoidan Prevents Radiation-Induced Fibrosis and Secondary Tumors in a Zebrafish Model

Authors
Wu, S.Y., Yang, W.Y., Cheng, C.C., Hsiao, M.C., Tsai, S.L., Lin, H.K., Lin, K.H., Yuh, C.H.
Source
Full text @ Cancers

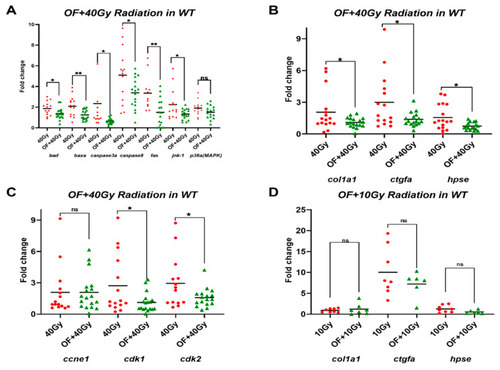
Expression levels of apoptosis, fibrosis, and cell proliferation-related genes in adult wild-type zebrafish treated with Oligo-Fucoidan and radiation. (A) The expression of B-cell lymphoma 2 (bcl2)-associated agonist of cell death (bad), bcl2-associated X protein a (baxa), apoptosis-related cysteine peptidase 3a (caspase 3a), apoptosis-related cysteine peptidase 8 (caspase 8), apoptosis antigen 1 (fas), c-Jun N-terminal kinase 1 (jnk-1), mitogen-activated protein kinase 8a (p38(MAPK)) in wild-type fish treated with 40 Gy irradiation (40 Gy) or treatment of Oligo-Fucoidan before 40 Gy irradiation (OF + 40Gy). (B) The expression of collagen, type I, alpha 1a (col1a1), connective tissue growth factor a (ctgfa), heparanase (hpse) in wild-type fish treated with 40 Gy irradiation (40 Gy) or treatment of Oligo-Fucoidan before 40 Gy irradiation (OF + 40 Gy). (C) The expression of cyclin E1 (ccne1), cyclin-dependent kinase 1 (cdk1), and cyclin-dependent kinase 2 (cdk2) in wild-type fish treated with 40 Gy irradiation (40 Gy) or treatment of Oligo-Fucoidan before 40 Gy irradiation (OF + 40 Gy). (D) The expression of col1a1, ctgfa, and hpse in wild-type fish treated with 10 Gy irradiation (10 Gy) or treatment of Oligo-Fucoidan before 10 Gy irradiation (OF + 10 Gy). The data are presented as dot plots with a horizontal line for the mean and are repeated in triplicate. The statistical significance was calculated using Student’s t-test (* p < 0.05, ** p < 0.01, ns: non-significant).

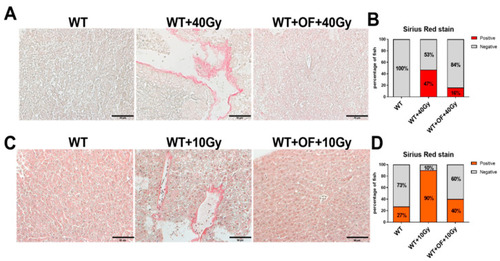
Sirius red staining in adult zebrafish treated with Oligo-Fucoidan and radiation. (A) The representative images of Sirius red staining of wild-type fish without irradiation (WT), with 40 Gy irradiation (WT + 40 Gy), or treatment of Oligo-Fucoidan before 40 Gy irradiation (WT + OF + 40 Gy). The images were taken at 400× magnification, and the scale shown is for 50 µm. (B) Statistical analysis from wild-type fish treated with 40 Gy irradiation. (C) The representative images of Sirius red staining of wild-type fish without irradiation (WT), with 10 Gy irradiation (WT + 10 Gy) or treatment of Oligo-Fucoidan before 10 Gy irradiation (WT + OF + 10 Gy). The images were taken at 400× magnification, and the scale shown is for 50 µm. (D) Statistical analysis from wild-type fish treated with 10 Gy irradiation.

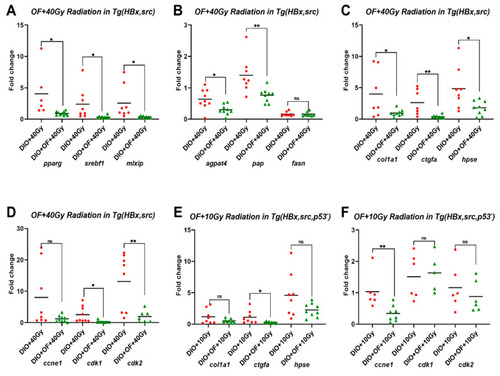
Expression levels of lipogenic factor and lipogenesis enzyme genes in adult zebrafish treated with Oligo-Fucoidan and radiation. (A) The expression of lipogenic factors (pparg, srebp1, and mlxlp) in HBx,src transgenic fish with diet-induced obesity plus 40 Gy irradiation (DIO + 40 Gy) or treatment of Oligo-Fucoidan before 40 Gy irradiation (DIO + OF + 40 Gy). (B) The expression of lipogenesis enzyme 1-acylglycerol-3-phosphate O-acyltransferase 4 (lysophosphatidic acid acyltransferase, delta) (agpat4, phospholipid phosphatase 1a (plpp1a)), transcript variant X1, mRNA (pap), and fatty acid synthase (fasn) in HBx,src transgenic fish with diet-induced obesity plus 40 Gy irradiation (DIO + 40 Gy) or treatment of Oligo-Fucoidan before 40 Gy irradiation (DIO + OF + 40 Gy). (C). The expression of collagen, type I, alpha 1a (col1a1), connective tissue growth factor a (ctgfa), and heparanase (hpse) in HBx,src transgenic fish with diet-induced obesity plus 40 Gy irradiation (DIO + 40Gy) or treatment of Oligo-Fucoidan before 40 Gy irradiation (DIO + OF + 40 Gy). (D). The expression of cyclin E1 (ccne1), cyclin-dependent kinase 1 (cdk1), and cyclin-dependent kinase 2 (cdk2) in HBx, src transgenic fish with diet-induced obesity plus 40 Gy irradiation (DIO + 40 Gy) or treatment of Oligo-Fucoidan before 40 Gy irradiation (DIO + OF + 40 Gy). (E). The expression of col1a1, ctgfa, and hpse in HBx, src, p53-transgenic fish with diet-induced obesity plus 10 Gy irradiation (DIO + 10 Gy) or treatment of Oligo-Fucoidan before 10 Gy irradiation (DIO + OF + 10 Gy). (F). The expression of ccne1, cdk1, and cdk2 in HBx,src,p53-transgenic fish with diet-induced obesity plus 10 Gy irradiation (DIO + 10 Gy) or treatment of Oligo-Fucoidan before 10 Gy irradiation (DIO + OF + 10 Gy). The data are presented as dot plots with a horizontal line for the mean and are repeated in triplicate. The statistical significance was calculated using Student’s t-test (* p < 0.05, ** p < 0.01, ns: non-significant).

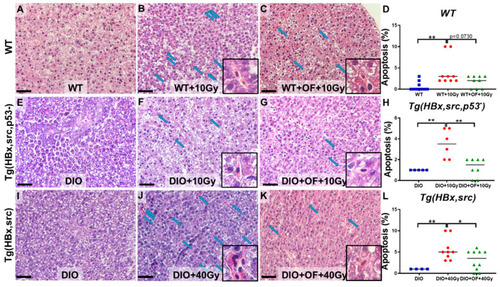
Representative images of hepatocyte apoptosis detected on hematoxylin and eosin (H&E) stain liver specimen from WT and transgenic fish with radiation without Oligo-Fucoidan or with Oligo-Fucoidan pretreatment. The images were taken at 400× magnification, and the scale shown is for 30 µm; the box area is enlarged to show the hepatocyte apoptosis, and the blue arrows pointed to the apoptotic hepatocytes. (A–C) The hepatocyte apoptosis in wild-type fish (WT) with 10 Gy irradiation (WT + 10 Gy) or treatment of Oligo-Fucoidan before 10 Gy irradiation (WT + OF + 10 Gy). (D) Statistical analysis of hepatocyte apoptosis feature of WT fish. (E–G) The hepatocyte apoptosis in Tg (HBx, src, p53−) transgenic fish with diet-induced obesity (DIO) with 10 Gy irradiation (DIO + 10 Gy) or treatment of Oligo-Fucoidan before 10 Gy irradiation (DIO + OF + 10 Gy). (H) Statistical analysis of hepatocyte apoptosis feature of Tg (HBx, src, p53−) fish. (I–K) The hepatocyte apoptosis in Tg (HBx, src) transgenic fish with diet-induced obesity (DIO) with 10 Gy irradiation (DIO + 40 Gy) or treatment of Oligo-Fucoidan before 40 Gy irradiation (DIO + OF + 40 Gy). (L) Statistical analysis of hepatocyte apoptosis feature of Tg (HBx, src) fish. The data are presented as dot plots with a horizontal line for the mean and are repeated in triplicate. The statistical significance was calculated using Student’s t-test (* p < 0.05, ** p < 0.01).

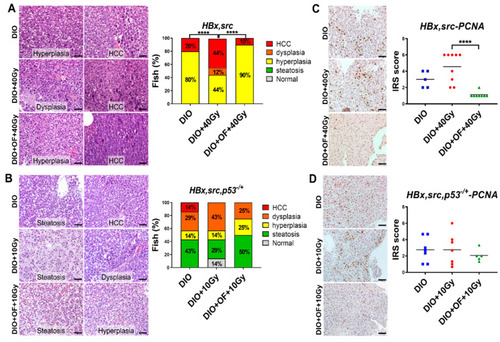
Histopathological analysis by H&E staining of hepatocytes in adult HBx, src transgenic zebrafish treated with Oligo-Fucoidan and radiation. (A,B) Representative images for H&E stain were shown. The images were taken at 400× magnification, and the scale shown is for 30 µm. (A) Statistical analysis of H&E staining of the liver sections from HBx, src transgenic fish diet-induced obesity (DIO) with 40 Gy irradiation (DIO + 40 Gy) and oral feeding Oligo-Fucoidan (DIO + OF + 40 Gy). (B) Statistical analysis of H&E staining of the liver sections from HBx,src,p53-transgenic fish diet-induced obesity (DIO) with 10 Gy irradiation (DIO + 10 Gy) and oral feeding Oligo-Fucoidan (DIO + OF + 10 Gy). The different colors denote the different pathological features as follows: gray: normal, green: steatosis, yellow: hyperplasia, orange: dysplasia, and red: hepatocellular carcinoma (HCC). N = 4–5 for the DIO group, and N = 9–10 for the other groups. (C,D) Representative images for proliferating cell nuclear antigen (PCNA) immunohistochemistry (IHC) stain were shown. The images were taken at 400× magnification, and the scale shown is for 30 µm. (C) Statistical analysis of PCNA immunohistochemistry staining of the liver sections from HBx,src transgenic fish diet-induced obesity (DIO) with 40 Gy irradiation (DIO + 40 Gy) and oral feeding Oligo-Fucoidan (DIO + OF + 40 Gy). (D) Statistical analysis of PCNA IHC staining of the liver sections from HBx,src,p53-transgenic fish diet-induced obesity (DIO) with 10 Gy irradiation (DIO + 10 Gy) and oral feeding Oligo-Fucoidan (DIO + OF + 10 Gy). The data are presented as dot plots with a horizontal line for the mean and are repeated in triplicate. The statistical significance was calculated using Student’s t-test (**** p < 0.0001).

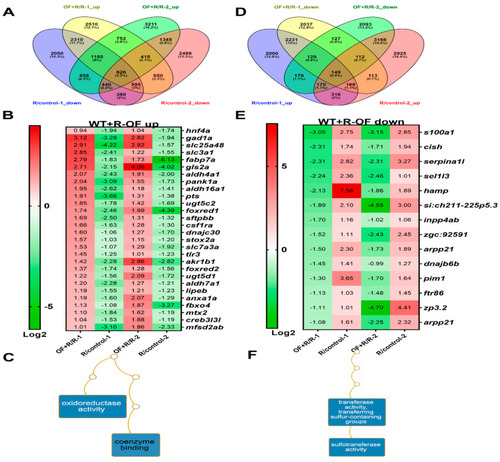
GeneTitan array analysis of the expression profile of wild-type zebrafish following different treatments. (A) Venn diagram of upregulation of genes in WT zebrafish irradiation and Oligo-Fucoidan pretreatment (OF + R) versus irradiation alone (R), overlapping with downregulated in irradiation (R) compare to no radiation (control). (B) The heatmap of genes that were upregulated in Oligo-Fucoidan pretreatment but downregulated by irradiation. First batch is 40 Gy (1), and second batch is 10 Gy (2). (C) Gene ontology analysis of Oligo-Fucoidan-induced genes in WT irradiation (D) Venn diagram of downregulation of genes in WT zebrafish irradiation and Oligo-Fucoidan pretreatment (OF + R) versus irradiation alone (R), overlapping with upregulated in irradiation (R) compared to no radiation (control). (E) The heatmap of genes that were downregulated in Oligo-Fucoidan pretreatment but upregulated by irradiation. First batch is 40 Gy (1), and second batch is 10 Gy (2). (F) Gene ontology analysis of Oligo-Fucoidan repressed genes in WT irradiation.

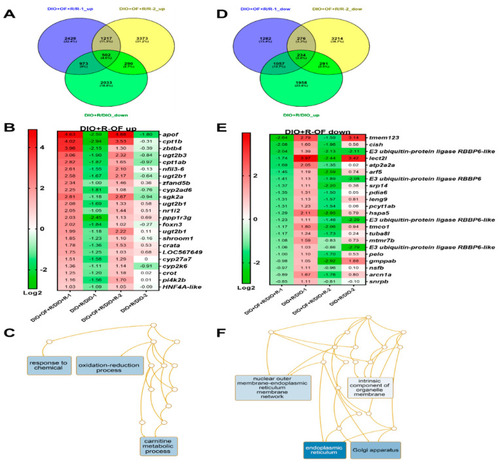
GeneTitan array analysis of the expression profile of HCC transgenic zebrafish following different treatments. (A) Venn diagram of upregulation of genes in HCC transgenic zebrafish diet-induced obesity with irradiation and Oligo-Fucoidan pretreatment (DIO + OF + R) compared to irradiation only (DIO + R), overlapping with downregulated in irradiation (DIO + R) compared to no radiation (DIO). (B) The heatmap of genes upregulated in Oligo-Fucoidan pretreatment but downregulated by irradiation. First batch is HBx, src transgenic fish with 40 Gy (1), and second batch is HBx, src, p53-transgenic fish with 10 Gy (2). (C) Gene ontology analysis of Oligo-Fucoidan induced genes in irradiated transgenic fish. (D) Venn diagram of downregulation of genes in HCC transgenic zebrafish diet-induced obesity with irradiation and Oligo-Fucoidan pretreatment (DIO + OF +R) compared to irradiation only (DIO + R), overlapping with downregulated in irradiation (DIO + R) compare to no radiation (DIO). (E) The heatmap of genes downregulated in Oligo-Fucoidan pretreatment but upregulated by irradiation. First batch is HBx, src transgenic fish with 40 Gy (1), and second batch is HBx, src, p53-transgenic fish with 10 Gy (2). (F) Gene ontology analysis of Oligo-Fucoidan repressed genes in irradiated transgenic fish.

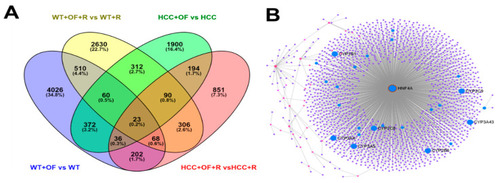
GeneTitan array analysis of expression profiles of wild-type and
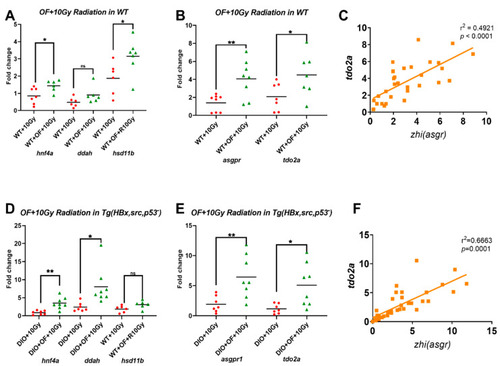
 HBx, src transgenic zebrafish following different treatments. (A) Venn diagram of overlapping differentially expressed genes. (B) HNF4A is the driver gene according to NetworkAnalyst (https://www.networkanalyst.ca/).

Upregulations of hnf4a, ddah1, 11b-hsd1, asgpr1, and hnf4a downstream target genes: tdo2a, in zebrafish after irradiation. (A) Gene expression profiles of hnf4a, ddah1, 11b-hsd1 and (B) zhi (asgpr1), tdo2a in WT zebrafish irradiation (WT + 10 Gy) and Oligo-Fucoidan pretreatment (WT + OF + R). (C) Positive correlations between zhi (asgpr1) and tdo2a were shown. (D) Gene expression profiles of hnf4a, ddah1, 11b-hsd1 and (E) zhi (asgpr1), tdo2a in HBx,src,p53-transgenic fish with diet-induced obesity plus 10 Gy irradiation (DIO + 10 Gy) or treatment of Oligo-Fucoidan before 10 Gy irradiation (DIO + OF + 10 Gy). (F) Positive correlations between zhi (asgpr1) and tdo2a were shown. Statistical significance was calculated by t-test (* p ≤ 0.05, ** p ≤ 0.01).

Acknowledgments
This image is the copyrighted work of the attributed author or publisher, and ZFIN has permission only to display this image to its users. Additional permissions should be obtained from the applicable author or publisher of the image. Full text @ Cancers