IMAGE

Figure 7

ID
ZDB-IMAGE-200718-64
Source
Figures for Wu et al., 2020
Image
Figure Caption

Figure 7

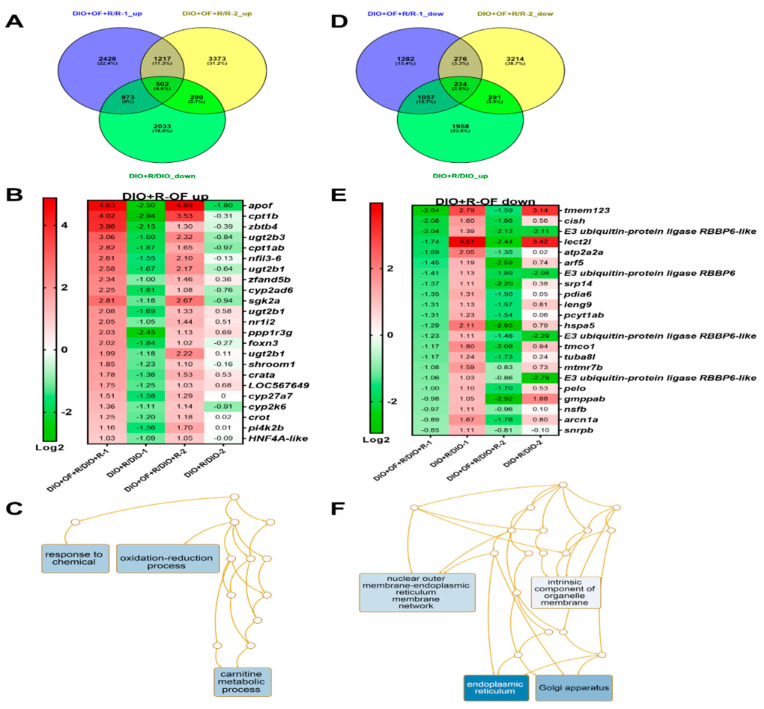
GeneTitan array analysis of the expression profile of HCC transgenic zebrafish following different treatments. (A) Venn diagram of upregulation of genes in HCC transgenic zebrafish diet-induced obesity with irradiation and Oligo-Fucoidan pretreatment (DIO + OF + R) compared to irradiation only (DIO + R), overlapping with downregulated in irradiation (DIO + R) compared to no radiation (DIO). (B) The heatmap of genes upregulated in Oligo-Fucoidan pretreatment but downregulated by irradiation. First batch is HBx, src transgenic fish with 40 Gy (1), and second batch is HBx, src, p53-transgenic fish with 10 Gy (2). (C) Gene ontology analysis of Oligo-Fucoidan induced genes in irradiated transgenic fish. (D) Venn diagram of downregulation of genes in HCC transgenic zebrafish diet-induced obesity with irradiation and Oligo-Fucoidan pretreatment (DIO + OF +R) compared to irradiation only (DIO + R), overlapping with downregulated in irradiation (DIO + R) compare to no radiation (DIO). (E) The heatmap of genes downregulated in Oligo-Fucoidan pretreatment but upregulated by irradiation. First batch is HBx, src transgenic fish with 40 Gy (1), and second batch is HBx, src, p53-transgenic fish with 10 Gy (2). (F) Gene ontology analysis of Oligo-Fucoidan repressed genes in irradiated transgenic fish.

Acknowledgments
This image is the copyrighted work of the attributed author or publisher, and ZFIN has permission only to display this image to its users. Additional permissions should be obtained from the applicable author or publisher of the image. Full text @ Cancers