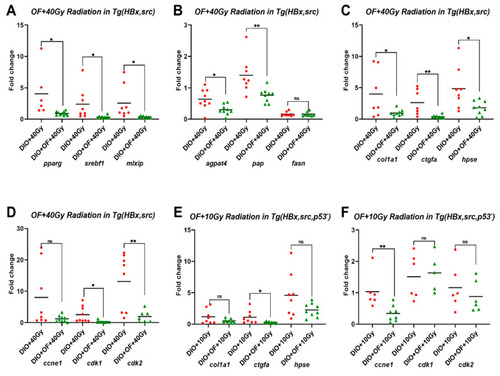
Expression levels of lipogenic factor and lipogenesis enzyme genes in adult zebrafish treated with Oligo-Fucoidan and radiation. (A) The expression of lipogenic factors (pparg, srebp1, and mlxlp) in HBx,src transgenic fish with diet-induced obesity plus 40 Gy irradiation (DIO + 40 Gy) or treatment of Oligo-Fucoidan before 40 Gy irradiation (DIO + OF + 40 Gy). (B) The expression of lipogenesis enzyme 1-acylglycerol-3-phosphate O-acyltransferase 4 (lysophosphatidic acid acyltransferase, delta) (agpat4, phospholipid phosphatase 1a (plpp1a)), transcript variant X1, mRNA (pap), and fatty acid synthase (fasn) in HBx,src transgenic fish with diet-induced obesity plus 40 Gy irradiation (DIO + 40 Gy) or treatment of Oligo-Fucoidan before 40 Gy irradiation (DIO + OF + 40 Gy). (C). The expression of collagen, type I, alpha 1a (col1a1), connective tissue growth factor a (ctgfa), and heparanase (hpse) in HBx,src transgenic fish with diet-induced obesity plus 40 Gy irradiation (DIO + 40Gy) or treatment of Oligo-Fucoidan before 40 Gy irradiation (DIO + OF + 40 Gy). (D). The expression of cyclin E1 (ccne1), cyclin-dependent kinase 1 (cdk1), and cyclin-dependent kinase 2 (cdk2) in HBx, src transgenic fish with diet-induced obesity plus 40 Gy irradiation (DIO + 40 Gy) or treatment of Oligo-Fucoidan before 40 Gy irradiation (DIO + OF + 40 Gy). (E). The expression of col1a1, ctgfa, and hpse in HBx, src, p53-transgenic fish with diet-induced obesity plus 10 Gy irradiation (DIO + 10 Gy) or treatment of Oligo-Fucoidan before 10 Gy irradiation (DIO + OF + 10 Gy). (F). The expression of ccne1, cdk1, and cdk2 in HBx,src,p53-transgenic fish with diet-induced obesity plus 10 Gy irradiation (DIO + 10 Gy) or treatment of Oligo-Fucoidan before 10 Gy irradiation (DIO + OF + 10 Gy). The data are presented as dot plots with a horizontal line for the mean and are repeated in triplicate. The statistical significance was calculated using Student’s t-test (* p < 0.05, ** p < 0.01, ns: non-significant).
|
