
- Title
-
Evolution of Epileptiform Activity in Zebrafish by Statistical-Based Integration of Electrophysiology and 2-Photon Ca2+ Imaging
- Authors
- Cozzolino, O., Sicca, F., Paoli, E., Trovato, F., Santorelli, F.M., Ratto, G.M., Marchese, M.
- Source
- Full text @ Cells
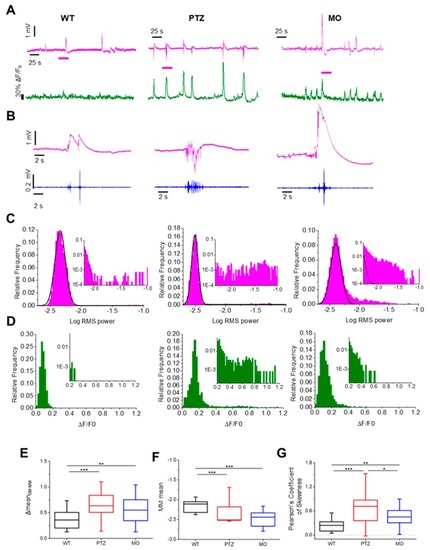
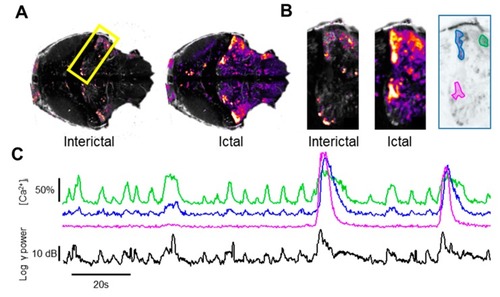
Statistics of the local field potential (LFP) spectral power and Ca2+ recordings in the three experimental groups. ( PHENOTYPE:
|
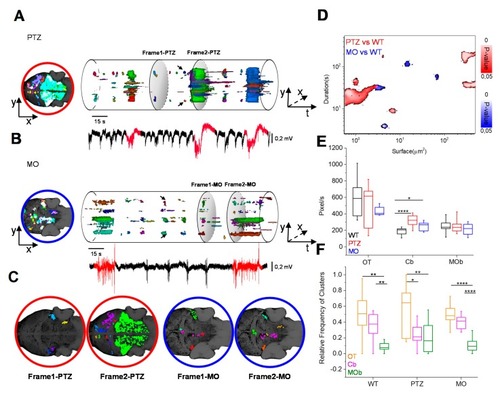
Dynamic evolution of the Ca2+ domains. ( PHENOTYPE:
|
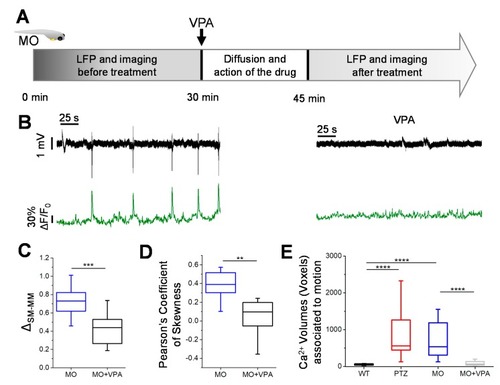
Valproate treatment. ( PHENOTYPE:
|
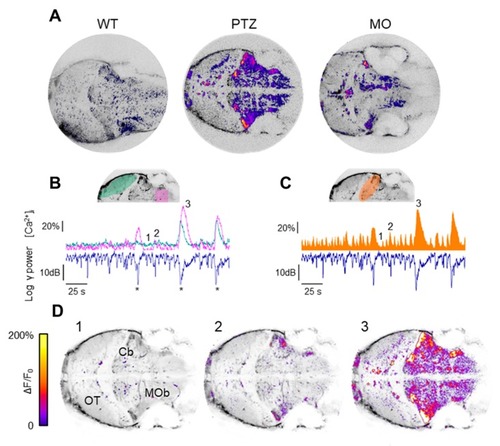
Localization of the sources of the LFP transients. ( |
Identification of the micro-circuitry associated with different epileptic-like events. ( |
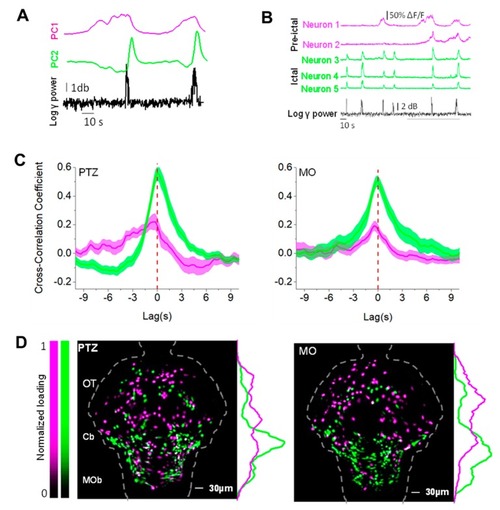
Principal component analysis (PCA) analysis identifies two different neuronal populations. ( |