IMAGE

Figure 1

ID
ZDB-IMAGE-200423-67
Source
Figures for Cozzolino et al., 2020
Image
Figure Caption

Figure 1

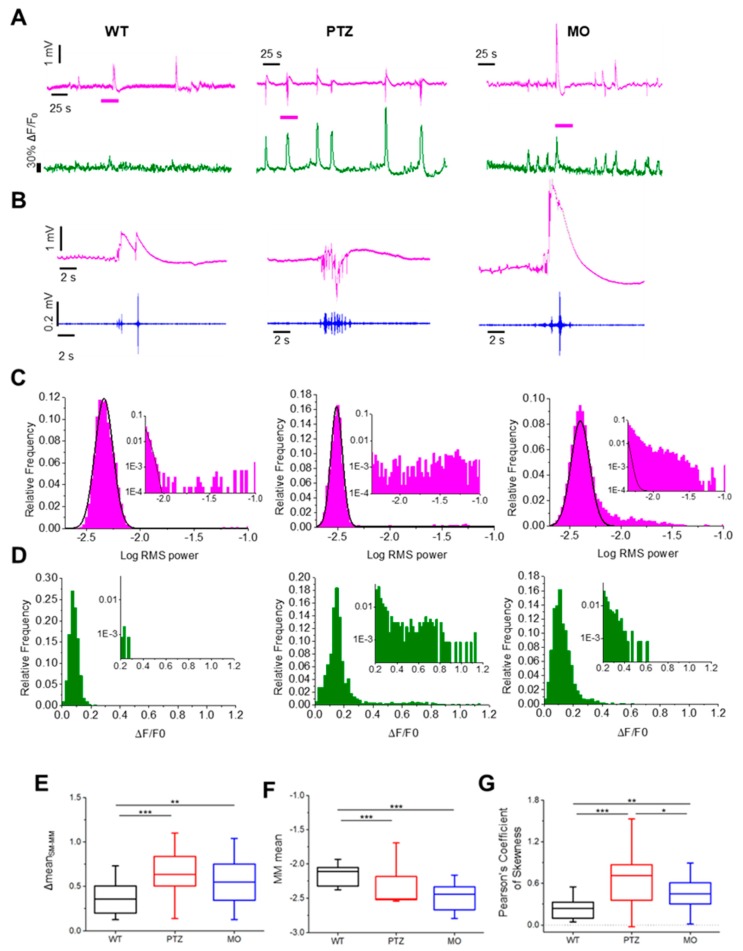
Statistics of the local field potential (LFP) spectral power and Ca2+ recordings in the three experimental groups. (A) Comparison of the statistics of LFP and whole brain Ca2+ fluctuations recorded in the three experimental groups, wild-type (WT) as control zebrafish, PTZ (Pentylenetetrazol) after treatment with pentylenetetrazole and MO (kcnj10a splice-morpholino) morphants of kcnj10a. The LFP transients in the PTZ and MO groups are associated to generalized positive fluctuation of the Ca2+. (B) Magnification of the LFP events is indicated by the magenta bars in panel A. The magenta traces show the full band data, while the blue traces show the data band passed in the 30–95 Hz range. (C) Statistical analysis of the electrophysiological activity. (D) Gaussian-like distribution of the ΔF/F0 values in the three models. (E) Difference between the Secondary Mode (SM) mean and the mean of the Main Mode (MM) (ΔmeanSM - MM). (F) Comparison of the MM mean of the three different models. (G) Statistics of the Pearson’s coefficient of skewness of the distribution of the fluorescence fluctuations, ΔF/F0, integrated on the entire optical section. Statistics have been cumulated from 5 recordings for each larva for each condition (* p ≤ 0.05,** p ≤ 0.01, *** p ≤ 0.001).

Figure Data
Acknowledgments
This image is the copyrighted work of the attributed author or publisher, and ZFIN has permission only to display this image to its users. Additional permissions should be obtained from the applicable author or publisher of the image. Full text @ Cells