FIGURE

Figure 4

ID
ZDB-FIG-200423-69
Publication
Cozzolino et al., 2020 - Evolution of Epileptiform Activity in Zebrafish by Statistical-Based Integration of Electrophysiology and 2-Photon Ca2+ Imaging
Other Figures
All Figure Page
Back to All Figure Page
Figure 4

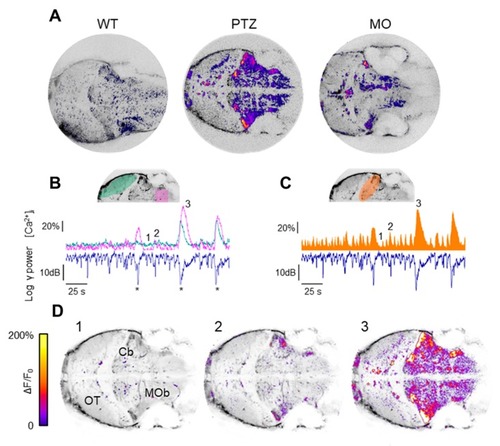
Localization of the sources of the LFP transients. (A) Maps obtained by computing the cross-correlation of the Ca2+ fluctuations of each pixel with the logarithm of the RMS (Root Mean Sqaure) power in the band 30–95 Hz in the three experimental models. (B) Example of recordings from a PTZ-treated larva where the correlation between the largest electrophysiological events (labelled by an asterisk) and Ca2+ activity measured in the OT (green trace) is apparent, and in the MOb (pink trace). (C) Ca2+ fluctuations measured in the Cb (orange trace, represented as an area to better appreciate details) correlate with both the large RMS events and the smaller interictal-like transients. (D) ΔF/F0 of the frames corresponding to baseline electrophysiological activity (labelled 1 in the above panels), to a small interictal event (2), in which Ca2+ activity is sparse and mostly localized in the Cb, and to a large electrophysiological event (3) associated to generalized Ca2+ activation. The overlay shows ΔF/F0 fluctuations larger than 10% over-imposed on the mean projection of the image stack.

Expression Data

Expression Detail
Antibody Labeling
Phenotype Data

Phenotype Detail
Acknowledgments
This image is the copyrighted work of the attributed author or publisher, and ZFIN has permission only to display this image to its users. Additional permissions should be obtained from the applicable author or publisher of the image. Full text @ Cells