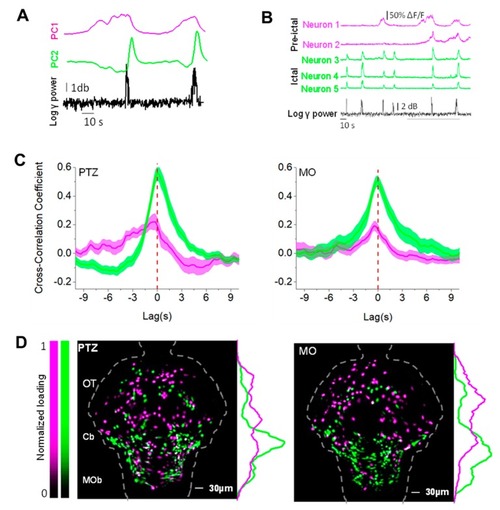
Principal component analysis (PCA) analysis identifies two different neuronal populations. (A) Population activity profiles represented by the first two PCA components describing the Ca2+ dynamics of single neurons. The black trace represents the corresponding RMS power. (B) Representative ΔF/F0 activity selected from single neurons best described by either PC1 (magenta) or by PC2 (green) in a PTZ-treated larva. PC1 neurons’ activation precedes the LFP bursts, whereas PC2 neurons activate during the LFP peaks. The grey bar indicates the events magnified in panel A. (C) Mean cross-correlograms of the two selected PCs with the aligned RMS power (n = 15 events from 4 morphants and n = 16 events from 4 PTZ larvae). (D) Cumulative maps for the PTZ (n = 4) and the MO (n = 4) larvae. Each cell is represented by its normalized loading (see the Materials and Methods Section) with respect to the PC1 and PC2. The plots on the right represent the normalized signal (arbitrary units) of the two-cell population along the rostro-caudal axis. The distribution of the two functional populations are significantly different in both models (p = 0.002 for the morphant and p < 0.0001 for the PTZ, two-samples Kolmogorov–Smirnoff test). In order to standardize the images, we registered the maps into a reference brain mask using a non-rigid image registration algorithm (see the Materials and Methods Section).
|
