FIGURE SUMMARY
Title

Impaired mitophagy links mitochondrial disease to epithelial stress in methylmalonyl-CoA mutase deficiency

Authors
Luciani, A., Schumann, A., Berquez, M., Chen, Z., Nieri, D., Failli, M., Debaix, H., Festa, B.P., Tokonami, N., Raimondi, A., Cremonesi, A., Carrella, D., Forny, P., Kölker, S., Diomedi Camassei, F., Diaz, F., Moraes, C.T., Di Bernardo, D., Baumgartner, M.R., Devuyst, O.
Source
Full text @ Nat. Commun.

Abnormal mitochondrial network in MMA kidney cells.

a Immunoblotting and quantification of MMUT and b its enzyme activity in control and MMA kidney cells, n = 3 biologically independent experiments. β-actin was used as a loading control. c, g Cells were transduced with adenoviral particles carrying the mitochondrially targeted green fluorescent protein (Ad-mito-GFP, green). c After 24 h post-transduction, the cells were immunostained for MMUT (red) and imaged by confocal microscopy. Yellow indicates the colocalization. d Quantification of methylmalonic acid (MMA) levels by liquid chromatography tandem mass spectrometry (LC-MS/MS, n = 3 biologically independent samples). e Representative electron micrographs and quantification of the shape (expressed as circularity) of the mitochondrial network in control and MMA cells; n= 527 mitochondria pooled from 24 control cells and n = 310 mitochondria pooled from 20 MMA cells. Values are pooled from two biologically independent experiments. Dotted yellow squares represent regions of the respective panels magnified. f Representative electron micrographs showing the mitochondrial network in kidney biopsies from an individual healthy control subject and a patient with MMA. g Representative inverted images (left) and quantification of shape (expressed as circularity, top right) or interconnectivity (bottom right) of the mitochondrial network in control and MMA cells; each point representing the average values for circularity or interconnectivity in a cell, n = 10 cells per each condition pooled from two biologically independent experiments. Plots represent mean ± SEM. Two-tailed Student’s t-test, *P < 0.05, ***P < 0.001 and #P < 0.0001 relative to control cells. Scale bars are 10 μm in c and g, and 1 μm (top) and 250 nm (bottom) in e and 2 μm in f. Unprocessed scans of original blots are shown in Supplementary Fig. 13. Source data are provided as a Source Data file.

Mitochondrial dysfunctions in MMA kidney cells.

a Representative immunoblotting and quantification of the indicated mitochondrial proteins; n = 5 biologically independent experiments. b The ratio between mitochondrial DNA (ND1) and nuclear DNA (ACTB) was determined by quantitative PCR; n = 4 biologically independent experiments. c Cells were immunostained for ATP5B (red) and imaged by confocal microscopy. Representative images and quantification of numbers of ATP5B+ structures per cell (n = 27 control cells and n = 40 MMA cells pooled from three biologically independent experiments). Nuclei counterstained with DAPI (blue). d, e Cells were exposed to mitochondrial complex I inhibitor Rotenone (Rot, 5 μM). After 24 h of treatment, the cells were loaded (d) with tetramethylrhodamine methyl ester (TMRM; green; mitochondrial membrane potential fluorescent probe, 50 nM for 30 min at 37 °C) and MitoTracker (red; fluorescent probe that localizes to mitochondria; 1 μM for 30 min at 37 °C) or (e) with MitoSOX (green; mitochondrial ROS indicator, 2.5 μM for 25 min at 37 °C) and MitoTracker (red), and analysed by confocal microscopy. Representative images and quantification of d membrane potential and e mitochondrial ROS (both calculated as ratio between TMRM and MitoTracker or MitoSOX and MitoTracker fluorescence intensities, with each point representing the average fluorescence intensity ratio in a cell). TMRM/MitoTracker: n = 21 untreated and Rot-treated control cells, n = 22 untreated MMA cells and n = 18 Rot-treated MMA cells. MitoSOX/MitoTracker: n = 31 untreated control cells and n = 40 Rot-treated control cells n = 36 untreated MMA cells and n = 31 Rot-treated MMA cells. Values are pooled from three biologically independent experiments. f Oxygen consumption rate (OCR) and individual parameters for basal respiration, ATP production and maximal respiration. OCRs were measured at baseline and after the sequential addition of Oligomycin (Oligo, 1 μM), FCCP (0.5 μM) and Rotenone (Rot; 1 μM) + Antimycin A (Ant; 1 μM), n = 3 biologically independent experiments. g Immunoblotting and quantification of the indicated proteins; n = 3 biologically independent experiments. Plots represent mean ± SEM. Two-tailed Student’s t-test, *P < 0.05, **P < 0.01, ***P < 0.001 and #P < 0.0001 relative to untreated or to Rot-treated control cells or to untreated MMA cells. β-actin was used as a loading control in a and b. Scale bars, 10 μM. NS non-significant. Source data are provided as a Source Data file.

Mitochondrial abnormalities and phenotypic changes in <italic>mmut-</italic>deficient zebrafish.

a Quantification of MMA levels by LC-MS/MS; n = 8 mmut+/+ and n = 12 mmutdel11/del11 zebrafish larvae. b, c Representative images and quantification of the mitochondrial shape (expressed as circularity) in (b) livers and in (c) kidneys of 10-dpf mmut zebrafish (n ≥ 9 and n ≥ 10 randomly selected and non-overlapping fields of views for zebrafish livers and kidneys, respectively). The whole-field images are pooled from three distinct zebrafish kidneys and livers, respectively. Dotted yellow squares contain images at higher magnification. d Oxygen consumption rate (OCR) and individual parameters for basal respiration in 10-dpf-mmut zebrafish, n = 6 mmut+/+ and 12 mmutdel11/del11 zebrafish larvae. e Zebrafish expressing mito-Grx1-roGFP2 in the liver were outcrossed with mmut+/del11 zebrafish. Representative images and quantification of the ratio between 405 (blue) and 488 (green) fluorescence intensities, with each point representing the average blue/green fluorescence intensity ratio in a zebrafish liver; n = 11 mmut+/+ and n = 12 mmutdel11/del11 zebrafish larvae. f Tracking analyses of motor behaviour in 10-dpf-mmut zebrafish fed with a high- or low-protein diet (HP or LP, respectively). Quantification of the distance, with each point representing the average distance covered by an individual zebrafish; n = 28 HP-fed mmut+/+, n = 26 LP-fed mmut+/+, n = 23 HP-fed mmutdel11/del11 and n = 27 LP-fed mmutdel11/del11 zebrafish larvae. g Distribution of mmut zebrafish (expressed as the percentage of the total zebrafish larvae) in 5-dpf or in 14-dpf zebrafish fed with either HP or LP diet  or in mmut zebrafish stably expressing mmut in the liver; n ≥ 3 biologically independent experiments, with each containing ~100 mmut zebrafish larvae. Plots represent mean ± SEM. Two-tailed Student’s t-test, *P < 0.05, **P < 0.01 and #P < 0.0001 relative to mmut+/+ or HP-mmutdel11/del11 in af. One-way ANOVA followed by Bonferroni’s post hoc test, ***P < 0.001 relative to mmut+/+ or 14-dpf-HP-fed mmut+/+ or to 14-dpf-HP-fed mmutdel11/del11 zebrafish larvae in g. Scale bars are 5 μm in b and c, and 100 μm in e. NS non-significant. Source data are provided as a Source Data file.

<italic>MMUT</italic> deficiency stimulates autophagy in MMA kidney cells.

a, b Cultured cells were exposed to lysosome-based proteolysis inhibitor Bafilomycin A1 (BfnA1, 250 nM for the indicated times). Representative immunoblotting and quantification of LC3-II; n = 3 biologically independent experiments. Two-tailed Student’s t-test, *P < 0.05 and **P < 0.01 relative to untreated control or MMA cells. b Representative inverted images and quantification of numbers of punctate LC3+ structures per cell; n = 122 untreated control cells, n = 127 BfnA1-treated control cells, n = 127 untreated MMA cells and n = 77 BfnA1-treated MMA cells. Values are pooled from three biologically independent experiments. One-way ANOVA followed by Bonferroni’s post hoc test, ***P < 0.001 relative to untreated control or MMA cells. c Representative electron micrographs and quantification of cytoplasm area occupied by autophagy vacuoles (AV; expressed as the percentage of the total area); n = 43 control cells and n = 45 MMA cells pooled from two biologically independent experiments. Arrowheads indicate EM-compatible AV. d, e Immunoblotting and quantification of (d) phosphorylated and total forms of mTORC1 substrates and of (e) FIP200 and ATG13, n = 3 biologically independent experiments. f Representative inverted images and quantification of numbers of ATG13+ (top) or Ptd-Ins3P+ (middle) or WIPI2+ (bottom) structures per cell, respectively. Number of ATG13+ structures: n = 86 control cells and n = 118 MMA cells. Number of Ptd-Ins3Pstructures: n = 41 control cells and n = 141 MMA cells. Number of WIPI2+ structures: n = 71 control cells and n = 253 MMA cells. Values are pooled from three biologically independent experiments. Plots represent mean ± SEM. Two-tailed Student’s t-test, *P < 0.05, **P < 0.01, ***P < 0.001 and #P < 0.0001 relative to control cells in cf. β-actin was used as a loading control in a, d and e. Scale bars are 10 μm in b and f, and 1 μm and 250 nm in c (left and right panels, respectively). NS non-significant. Source data are provided as a Source Data file.

Impaired mitophagy-mediated degradation of MMA diseased mitochondria.

af Cells were exposed to Rotenone (5 μM) for the indicated time. a Immunoblotting and quantification of indicated mitochondrial proteins; n = 3 biologically independent experiments. GAPDH was used as a loading control. b The ratio between mitochondrial (ND1) and nuclear DNA (ACTB) was determined by quantitative PCR; n = 4 biologically independent experiments. c Workflow of the strategy used to monitor the cellular delivery of damaged mitochondria to lysosomal compartments. Cells were transduced with adenoviral particles carrying the mitochondrially targeted form of Keima (mt-Keima) for 24 h. Representative images and quantification of ratio between red and green fluorescence intensities, with each point representing the average red/green fluorescence intensity ratio in a cell; n = 46 untreated control cells and n = 52 Rotenone-treated control cells, and n = 51 untreated MMA cells and n = 53 Rotenone-treated MMA cells. df Cells were transduced with adenoviral particles bearing the mitochondrially targeted green fluorescent protein (Ad-mito-GFP). After 24 h post-transduction, the cells were exposed to Rotenone for 4 h, immunostained for Parkin (magenta) and analysed by confocal microscopy. d Representative images and quantification of number of (e) Parkin+ and (f) GFP/Parkin+ structures. Number of Parkin+ structures per cell: n = 30 untreated and Rotenone-treated control cells, n = 39 untreated MMA cells and n = 52 Rotenone-treated MMA cells. Number of GFP/Parkin+ structures (expressed as the percentage of total mitochondria): n = 5 randomly selected and non-overlapping fields of views per each condition. Each whole-field image contains at least 10 cells. The whole-field images are pooled from three biologically independent experiments. g Representative electron micrographs (EM) showing the engulfment of mitochondria within EM-compatible, double membraned-autophagic vacuoles in control but not in MMA cells. Values in c and e are pooled from three biologically independent experiment. Plots represent mean ± SEM. Two-tailed Student’s t-test, *P < 0.05, **P < 0.01, ***P < 0.001 and #P < 0.0001 relative to untreated control or to Rotenone-treated control cells in a, b and f. One-way ANOVA followed by Bonferroni’s post hoc test, *P < 0.05 and ***P < 0.001 relative to untreated control or to Rotenone-treated control cells in c and e. Scale bars are 10 μm in c and d, and 250 nm in g. NS non-significant. Source data are provided as a Source Data file.

Rescue of mitochondrial function and homeostasis by re-expressing PINK1 in MMA kidney cells.

ac Cells were transduced with adenovirus particles expressing mitochondrially targeted GFP (Ad-mito-GFP, green) and with adenovirus particles bearing either Null or HA-PINK1. Cells were immunostained for HA (red) and Parkin (red). a Representative images and b quantification of numbers of Parkin+ structures in a cell. Number of control cells transduced with Null (n = 25) or HA-PINK1 (n = 39) and MMA cells transduced with Null (n = 57) or HA-PINK1 (n = 55). c Quantification of mito-GFP/Parkin+ structures (expressed as the percentage of total mitochondria); n 4 randomly selected and non-overlapping fields of views per each condition. Nuclei counterstained with DAPI (blue). d, e Null and HA-PINK1-expressing cells were transduced with adenovirus particles bearing mt-Keima. d Confocal microscopy-based quantification of the red/green fluorescence intensity ratio in a cell. Number of control cells transduced with Null (n = 46) or HA-PINK1 (n = 38) and MMA cells transduced with Null (n = 51) or HA−PINK1 (n = 54). e Representative immunoblotting and quantification of the indicated mitochondrial proteins; n = 5 biologically independent experiments. f, g Cells were loaded with (f) TMRM (green) or (g) MitoSOX (green) and MitoTracker (red), and analysed by confocal microscopy. Quantification of TMRM/MitoTracker or MitoSOX/MitoTracker fluorescence intensity ratio in a cell. Number of control cells transduced with Null (n = 43) or HA-PINK1 (n = 62) and MMA cells transduced with Null (n = 83) or HA-PINK1 (n = 84) for TMRM/MitoTracker. Number of control cells transduced with Null (n = 38) or HA-PINK1 (n = 56) and MMA cells transduced with Null (n = 59) or HA-PINK1 (n = 64) for MitoSOX/MitoTracker. h Oxygen consumption rate (OCR) and individual parameters for basal respiration, ATP production and maximal respiration. OCRs were measured at baseline and after the sequential addition of Oligomycin (Oligo, 1 μM), FCCP (0.5 μM) and Rotenone (Rot; 1 μM) + Antimycin A (Ant; 1 μM). Values in ah are pooled from three biologically independent experiments. Plots represent mean ± SEM. One-way ANOVA followed by Bonferroni’s post hoc test, *P < 0.05 and ***P < 0.001 relative to control or MMA cells transduced with Null in b, d, f and g. Two-tailed Student’s t-test, *P < 0.05, **P < 0.01, ***P < 0.001 and #P < 0.0001 relative to control and MMA cells transduced with Null in c, e and h. Scale bars,10 μm. NS non-significant. Source data are provided as a Source Data file.

<italic>MMUT</italic> deletion damages mitochondria and blunts PINK1-directed mitophagy triggering epithelial stress in kidney cells.

ai Mouse proximal tubule (mPT) cells from floxed Mmut kidneys were transduced with adenovirus bearing Empty or Cre-recombinase for 5 days. a Workflow of strategy used to generate the floxed Mmut alleles. b, c Validation of Mmut deletion by b immunoblotting (n = 4 biologically independent experiments) and c by LC-MS/MS analysis of MMA levels (n = 9 replicates pooled from three biologically independent experiments). d Cells were loaded with TMRM (green) and MitoTracker (red). Confocal microscopy-based quantification of fluorescence intensity ratio in a cell. Number of cells transduced with Ad-Empty (n = 25) or Ad-Cre (n = 45). e Oxygen consumption rate (OCR) and individual parameters for basal respiration, ATP production and maximal respiration. OCRs were measured at baseline and after the sequential addition of Oligomycin (Oligo, 1 μM), FCCP (0.5 μM) and Rotenone (Rot, 1 μM) + Antimycin A (Ant, 1 μM). fMmut cells were transduced with adenovirus expressing mitochondrially targeted form of Keima (mt-Keima) for 24 h and exposed to Rotenone (Rot, 5 μM for 24 h). Representative images and quantification of red/green fluorescence intensity ratio in a cell. Number of untreated (n = 68) and Rot-treated (n = 57) control cells, and number of untreated (n = 51) and Rot-treated (n = 58) Mmut-deleted cells. g, h Control and Mmut-deleted cells were transduced with adenovirus expressing Null or HA-PINK1 for 24 h. g Cells were loaded with MitoSOX (green) and analysed by confocal microscopy. Representative images and quantification of MitoSOX fluorescence intensity, n ≥ 4 randomly selected and non-overlapping fields of views per condition, with each containing ~10 cells. h Representative immunoblotting and quantification of Lcn2, n = 4 biologically independent experiments. β-actin was used as a loading control. Values in dg are pooled from three biologically independent experiments. Plots represent mean ± SEM. Asterisks denote non-specific bands in b and h. Two-tailed Student’s t-test, *P < 0.05, **P < 0.01, ***P < 0.01 and #P < 0.0001 relative to control cells in be or relative to control or Mmut-deleted cells transduced with Ad-Null in h. One-way ANOVA followed by Bonferroni’s post hoc test, **P < 0.01 and ***P < 0.001 relative to untreated control cells or relative to control or Mmut-deleted cells transduced with Ad-Null in f and g. Scale bars,10 μm. NS non-significant. Source data are provided as a Source Data file.

Mitochondria-targeted ROS scavenger mito-TEMPO repairs mitochondrial functions in MMA kidney cells.

a Gene ontology (GO) annotations significantly upregulated (red) and downregulated (green) by the in silico-prioritized hits according to Drug Set Enrichment Analysis (DSEA). bg Cells were treated in the presence or in the absence of mito-TEMPO (MT; 10 μM for 24 h). b Quantification of MMA levels by LC-MS/MS; n = 6 replicates. One-way ANOVA followed by Bonferroni’s post hoc test, ***P < 0.001 relative to untreated control or MMA cells. c Cells were transduced with adenovirus particles bearing the mitochondrially targeted GFP (Ad-mito-GFP, green). After 24 h post-transduction, the cells were treated with MT and analysed by confocal microscopy. Representative inverted images and quantification of mitochondrial circularity or interconnectivity. Circularity: n = 15 cells per each condition. Interconnectivity: n = 15 untreated and MT-treated control cells, n = 15 and n = 13 untreated and MT-treated MMA cells, respectively. One-way ANOVA followed by Bonferroni’s post hoc test, *P < 0.05 and ***P < 0.001 relative to untreated control or MMA cells. d Representative immunoblotting and quantification of the indicated mitochondrial proteins. GAPDH was used as a loading control. e Oxygen consumption rate (OCR) and individual parameters for basal respiration, ATP production and maximal respiration. OCRs were measured at baseline and after the sequential addition of Oligomycin (Oligo, 1 μM), FCCP (0.5 μM) and Rotenone (Rot, 1 μM) + Antimycin A (Ant, 1 μM). f Cells were loaded with MitoSOX (green, 2.5 μM for 30 min at 37 °C) and MitoTracker (red; 1 μM for 30 min at 37 °C), and analysed by confocal microscopy. Representative images and quantification of mitochondrial ROS (calculated as the ratio between MitoSOX and MitoTracker fluorescence intensities; each point representing the average fluorescence intensity ratio in a cell). Number of untreated (n = 36) or MT-treated (n = 28) control cells and number of untreated (n = 51) or MT-treated (n = 28) MMA cells. One-way ANOVA followed by Bonferroni’s post hoc test, ***P < 0.001 relative to untreated control or MMA cells. g Representative immunoblotting and quantification of LCN2, n = 4 biologically independent experiments. β-actin was used as a loading control. Plots represent mean ± SEM. Values in bf are pooled from three biologically independent experiments. Two-tailed Student’s t-test, *P < 0.05, **P < 0.01, ***P < 0.001 and #P < 0.0001 relative to untreated control or MMA cells in d, e and g. Scale bars, 10 μm. NS non-significant. Source data are provided as a Source Data file.

Mitochondria-targeted ROS scavenger MitoQ rescues the MMA–associated phenotypes in <italic>mmut</italic>–deficient zebrafish.

ad Zebrafish larvae were treated with vehicle or with the mitochondria-targeted ROS scavenger MitoQ (100 nM or 200 nM, respectively, for 24 h). a Representative images and quantification of ratio between 405 (blue) and 488 (green) fluorescence intensities in mmut zebrafish expressing mito-Grx1-roGFP2 in the liver. Each point represents the average fluorescence intensity ratio in an individual zebrafish liver; n = 6 vehicle-treated mmut+/+ zebrafish and n = 7 vehicle-treated mmutdel11/del11 zebrafish, and n = 5 MitoQ-treated mmutdel11/del11 zebrafish larvae. Kruskal‒Wallis followed by Dunn’s multiple comparison test, *P < 0.05 and **P < 0.01 relative to vehicle-treated mmut+/+ or vehicle-treated mmutdel11/del11 zebrafish larvae. b Tracking analyses of motor behaviour in 10-dpf-mmut zebrafish larvae. Quantification of distance, with each point representing the average distance covered by an individual zebrafish; n = 28 vehicle-treated mmut+/+, n = 27 vehicle-treated mmutdel11/del11 and n = 31 MitoQ-treated mmutdel11/del11 zebrafish larvae. One-way ANOVA followed by Bonferroni’s post hoc test, *P < 0.05 and **P < 0.01 relative to vehicle-treated mmut+/+ or to vehicle-treated mmutdel11/del11 zebrafish larvae. c Distribution of mmut zebrafish larvae (expressed as the percentage of total larvae) after treatment with either vehicle or MitoQ. Values are from one biological repeat, with n ≥ 77mmut zebrafish larvae per each group/condition. Chi-square goodness of fit test, ***P < 0.001 and #P < 0.0001 relative to vehicle-treated mmut+/+ or mmutdel11/del11 zebrafish larvae. d Quantification of MMA levels by LC-MS/MS; n = 5 vehicle-treated mmut+/+, n = 9 vehicle-treated mmutdel11/del11 and n = 8 MitoQ-treated mmutdel11/del11 zebrafish larvae. Plots represent mean ± SEM. Kruskal–Wallis followed by Dunn’s multiple comparison test, **P < 0.01 relative to vehicle-treated mmut+/+ or vehicle-treated mmutdel11/del11 zebrafish larvae. Scale bars, 100 μm. NS non-significant. Source data are provided as a Source Data file.

Proposed model depicting the link between mitochondrial dysfunctions and epithelial stress in MMA.

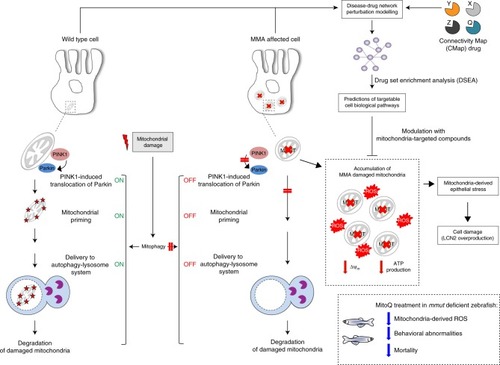
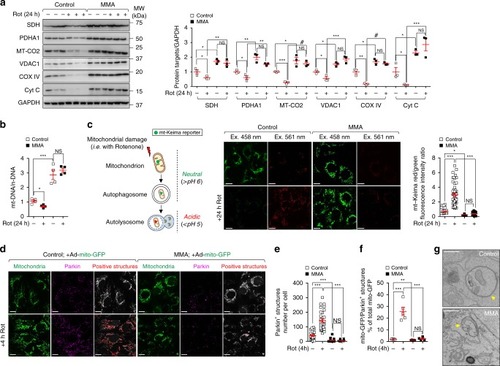
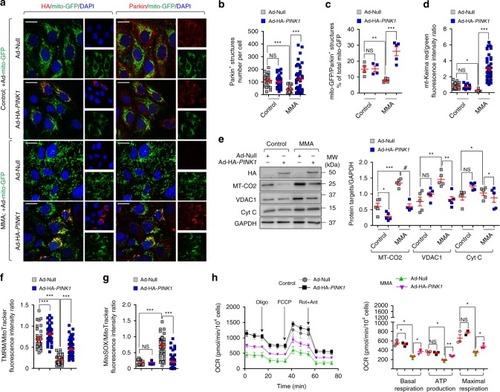
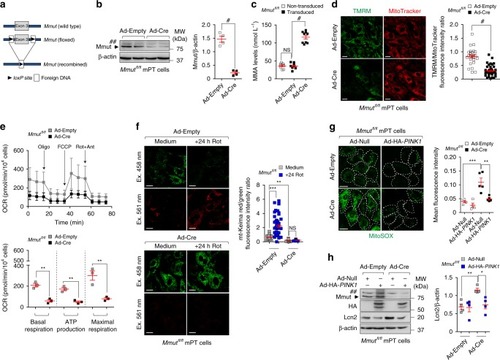
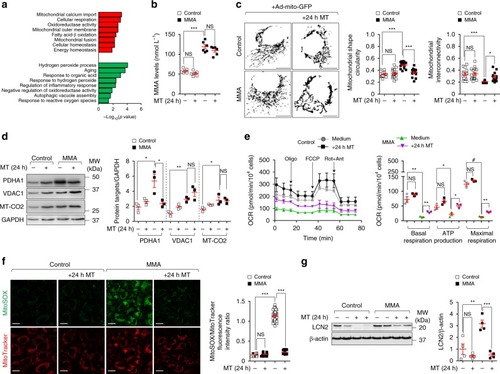
In wild-type kidney cells (left), mitochondrial stress (e.g. treatment with Rotenone) stimulates PINK1-induced translocation of Parkin to damaged mitochondria. This triggers mitophagy and the subsequent disposal of dysfunctional mitochondria through autophagy–lysosome degradation systems, thereby safeguarding the homeostasis and function of the mitochondrial network. By contrast, in MMA-affected kidney cells (right), the impaired PINK/Parkin-mediated mitophagy impedes the delivery of damaged mitochondria and their degradation by autophagy‒lysosome pathways. This leads to accumulation of MMA-diseased mitochondria and exacerbates the mitochondrial alterations induced by MMUT deficiency, including accumulation of toxic metabolites, collapsed mitochondrial membrane potential (Δψm), and abnormal energetic profiling and increased mitochondrial ROS. These mitochondrial alterations generate epithelial stress, causing ultimately cell damage (e.g. LCN2 overproduction). Drug–disease network perturbation modelling, based on transcriptome-wide profiles from MMA patient-derived kidney cells against a large compendium of gene signatures derived from 1309 small bioactive drug compounds, identifies targetable disease-relevant cell biological pathways. The modulation of the identified targets (e.g. treatment with mitochondria-targeted ROS scavengers MT or MitoQ) repairs mitochondrial dysfunctions, neutralizes epithelial stress and cell damage in MMA cells, and improves disease-relevant phenotypes in mmut–deficient zebrafish.

ZFIN is incorporating published figure images and captions as part of an ongoing project. Figures from some publications have not yet been curated, or are not available for display because of copyright restrictions.

Acknowledgments
This image is the copyrighted work of the attributed author or publisher, and ZFIN has permission only to display this image to its users. Additional permissions should be obtained from the applicable author or publisher of the image. Full text @ Nat. Commun.