|
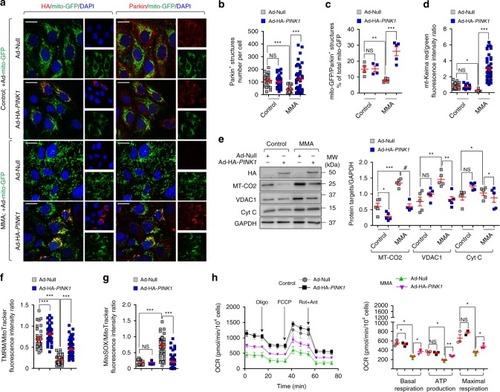
Rescue of mitochondrial function and homeostasis by re-expressing PINK1 in MMA kidney cells.a–c Cells were transduced with adenovirus particles expressing mitochondrially targeted GFP (Ad-mito-GFP, green) and with adenovirus particles bearing either Null or HA-PINK1. Cells were immunostained for HA (red) and Parkin (red). a Representative images and b quantification of numbers of Parkin+ structures in a cell. Number of control cells transduced with Null (n = 25) or HA-PINK1 (n = 39) and MMA cells transduced with Null (n = 57) or HA-PINK1 (n = 55). c Quantification of mito-GFP/Parkin+ structures (expressed as the percentage of total mitochondria); n ≥ 4 randomly selected and non-overlapping fields of views per each condition. Nuclei counterstained with DAPI (blue). d, e Null and HA-PINK1-expressing cells were transduced with adenovirus particles bearing mt-Keima. d Confocal microscopy-based quantification of the red/green fluorescence intensity ratio in a cell. Number of control cells transduced with Null (n = 46) or HA-PINK1 (n = 38) and MMA cells transduced with Null (n = 51) or HA−PINK1 (n = 54). e Representative immunoblotting and quantification of the indicated mitochondrial proteins; n = 5 biologically independent experiments. f, g Cells were loaded with (f) TMRM (green) or (g) MitoSOX (green) and MitoTracker (red), and analysed by confocal microscopy. Quantification of TMRM/MitoTracker or MitoSOX/MitoTracker fluorescence intensity ratio in a cell. Number of control cells transduced with Null (n = 43) or HA-PINK1 (n = 62) and MMA cells transduced with Null (n = 83) or HA-PINK1 (n = 84) for TMRM/MitoTracker. Number of control cells transduced with Null (n = 38) or HA-PINK1 (n = 56) and MMA cells transduced with Null (n = 59) or HA-PINK1 (n = 64) for MitoSOX/MitoTracker. h Oxygen consumption rate (OCR) and individual parameters for basal respiration, ATP production and maximal respiration. OCRs were measured at baseline and after the sequential addition of Oligomycin (Oligo, 1 μM), FCCP (0.5 μM) and Rotenone (Rot; 1 μM) + Antimycin A (Ant; 1 μM). Values in a–h are pooled from three biologically independent experiments. Plots represent mean ± SEM. One-way ANOVA followed by Bonferroni’s post hoc test, *P < 0.05 and ***P < 0.001 relative to control or MMA cells transduced with Null in b, d, f and g. Two-tailed Student’s t-test, *P < 0.05, **P < 0.01, ***P < 0.001 and #P < 0.0001 relative to control and MMA cells transduced with Null in c, e and h. Scale bars,10 μm. NS non-significant. Source data are provided as a Source Data file.
|