|
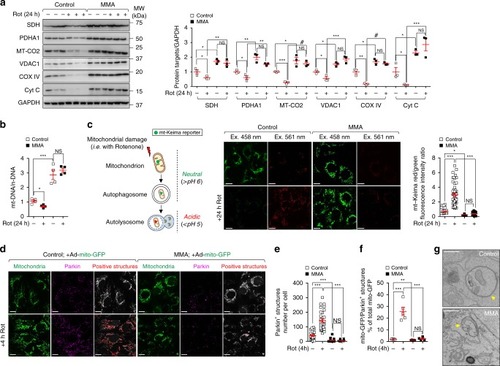
Impaired mitophagy-mediated degradation of MMA diseased mitochondria.a–f Cells were exposed to Rotenone (5 μM) for the indicated time. a Immunoblotting and quantification of indicated mitochondrial proteins; n = 3 biologically independent experiments. GAPDH was used as a loading control. b The ratio between mitochondrial (ND1) and nuclear DNA (ACTB) was determined by quantitative PCR; n = 4 biologically independent experiments. c Workflow of the strategy used to monitor the cellular delivery of damaged mitochondria to lysosomal compartments. Cells were transduced with adenoviral particles carrying the mitochondrially targeted form of Keima (mt-Keima) for 24 h. Representative images and quantification of ratio between red and green fluorescence intensities, with each point representing the average red/green fluorescence intensity ratio in a cell; n = 46 untreated control cells and n = 52 Rotenone-treated control cells, and n = 51 untreated MMA cells and n = 53 Rotenone-treated MMA cells. d‒f Cells were transduced with adenoviral particles bearing the mitochondrially targeted green fluorescent protein (Ad-mito-GFP). After 24 h post-transduction, the cells were exposed to Rotenone for 4 h, immunostained for Parkin (magenta) and analysed by confocal microscopy. d Representative images and quantification of number of (e) Parkin+ and (f) GFP/Parkin+ structures. Number of Parkin+ structures per cell: n = 30 untreated and Rotenone-treated control cells, n = 39 untreated MMA cells and n = 52 Rotenone-treated MMA cells. Number of GFP/Parkin+ structures (expressed as the percentage of total mitochondria): n = 5 randomly selected and non-overlapping fields of views per each condition. Each whole-field image contains at least 10 cells. The whole-field images are pooled from three biologically independent experiments. g Representative electron micrographs (EM) showing the engulfment of mitochondria within EM-compatible, double membraned-autophagic vacuoles in control but not in MMA cells. Values in c and e are pooled from three biologically independent experiment. Plots represent mean ± SEM. Two-tailed Student’s t-test, *P < 0.05, **P < 0.01, ***P < 0.001 and #P < 0.0001 relative to untreated control or to Rotenone-treated control cells in a, b and f. One-way ANOVA followed by Bonferroni’s post hoc test, *P < 0.05 and ***P < 0.001 relative to untreated control or to Rotenone-treated control cells in c and e. Scale bars are 10 μm in c and d, and 250 nm in g. NS non-significant. Source data are provided as a Source Data file.
|