|
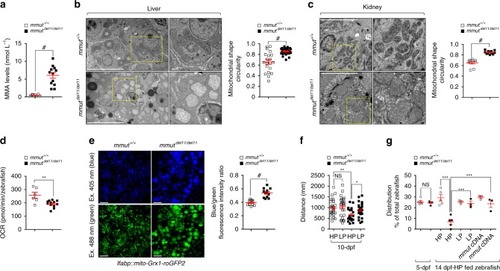
Mitochondrial abnormalities and phenotypic changes in <italic>mmut-</italic>deficient zebrafish.a Quantification of MMA levels by LC-MS/MS; n = 8 mmut+/+ and n = 12 mmutdel11/del11 zebrafish larvae. b, c Representative images and quantification of the mitochondrial shape (expressed as circularity) in (b) livers and in (c) kidneys of 10-dpf mmut zebrafish (n ≥ 9 and n ≥ 10 randomly selected and non-overlapping fields of views for zebrafish livers and kidneys, respectively). The whole-field images are pooled from three distinct zebrafish kidneys and livers, respectively. Dotted yellow squares contain images at higher magnification. d Oxygen consumption rate (OCR) and individual parameters for basal respiration in 10-dpf-mmut zebrafish, n = 6 mmut+/+ and 12 mmutdel11/del11 zebrafish larvae. e Zebrafish expressing mito-Grx1-roGFP2 in the liver were outcrossed with mmut+/del11 zebrafish. Representative images and quantification of the ratio between 405 (blue) and 488 (green) fluorescence intensities, with each point representing the average blue/green fluorescence intensity ratio in a zebrafish liver; n = 11 mmut+/+ and n = 12 mmutdel11/del11 zebrafish larvae. f Tracking analyses of motor behaviour in 10-dpf-mmut zebrafish fed with a high- or low-protein diet (HP or LP, respectively). Quantification of the distance, with each point representing the average distance covered by an individual zebrafish; n = 28 HP-fed mmut+/+, n = 26 LP-fed mmut+/+, n = 23 HP-fed mmutdel11/del11 and n = 27 LP-fed mmutdel11/del11 zebrafish larvae. g Distribution of mmut zebrafish (expressed as the percentage of the total zebrafish larvae) in 5-dpf or in 14-dpf zebrafish fed with either HP or LP diet or in mmut zebrafish stably expressing mmut in the liver; n ≥ 3 biologically independent experiments, with each containing ~100 mmut zebrafish larvae. Plots represent mean ± SEM. Two-tailed Student’s t-test, *P < 0.05, **P < 0.01 and #P < 0.0001 relative to mmut+/+ or HP-mmutdel11/del11 in a–f. One-way ANOVA followed by Bonferroni’s post hoc test, ***P < 0.001 relative to mmut+/+ or 14-dpf-HP-fed mmut+/+ or to 14-dpf-HP-fed mmutdel11/del11 zebrafish larvae in g. Scale bars are 5 μm in b and c, and 100 μm in e. NS non-significant. Source data are provided as a Source Data file.
|