|
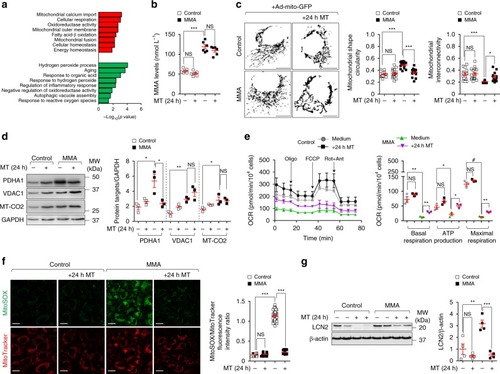
Mitochondria-targeted ROS scavenger mito-TEMPO repairs mitochondrial functions in MMA kidney cells.a Gene ontology (GO) annotations significantly upregulated (red) and downregulated (green) by the in silico-prioritized hits according to Drug Set Enrichment Analysis (DSEA). b–g Cells were treated in the presence or in the absence of mito-TEMPO (MT; 10 μM for 24 h). b Quantification of MMA levels by LC-MS/MS; n = 6 replicates. One-way ANOVA followed by Bonferroni’s post hoc test, ***P < 0.001 relative to untreated control or MMA cells. c Cells were transduced with adenovirus particles bearing the mitochondrially targeted GFP (Ad-mito-GFP, green). After 24 h post-transduction, the cells were treated with MT and analysed by confocal microscopy. Representative inverted images and quantification of mitochondrial circularity or interconnectivity. Circularity: n = 15 cells per each condition. Interconnectivity: n = 15 untreated and MT-treated control cells, n = 15 and n = 13 untreated and MT-treated MMA cells, respectively. One-way ANOVA followed by Bonferroni’s post hoc test, *P < 0.05 and ***P < 0.001 relative to untreated control or MMA cells. d Representative immunoblotting and quantification of the indicated mitochondrial proteins. GAPDH was used as a loading control. e Oxygen consumption rate (OCR) and individual parameters for basal respiration, ATP production and maximal respiration. OCRs were measured at baseline and after the sequential addition of Oligomycin (Oligo, 1 μM), FCCP (0.5 μM) and Rotenone (Rot, 1 μM) + Antimycin A (Ant, 1 μM). f Cells were loaded with MitoSOX (green, 2.5 μM for 30 min at 37 °C) and MitoTracker (red; 1 μM for 30 min at 37 °C), and analysed by confocal microscopy. Representative images and quantification of mitochondrial ROS (calculated as the ratio between MitoSOX and MitoTracker fluorescence intensities; each point representing the average fluorescence intensity ratio in a cell). Number of untreated (n = 36) or MT-treated (n = 28) control cells and number of untreated (n = 51) or MT-treated (n = 28) MMA cells. One-way ANOVA followed by Bonferroni’s post hoc test, ***P < 0.001 relative to untreated control or MMA cells. g Representative immunoblotting and quantification of LCN2, n = 4 biologically independent experiments. β-actin was used as a loading control. Plots represent mean ± SEM. Values in b–f are pooled from three biologically independent experiments. Two-tailed Student’s t-test, *P < 0.05, **P < 0.01, ***P < 0.001 and #P < 0.0001 relative to untreated control or MMA cells in d, e and g. Scale bars, 10 μm. NS non-significant. Source data are provided as a Source Data file.
|