IMAGE

Fig. 2

ID
ZDB-IMAGE-200306-86
Source
Figures for Luciani et al., 2020
Image
Figure Caption

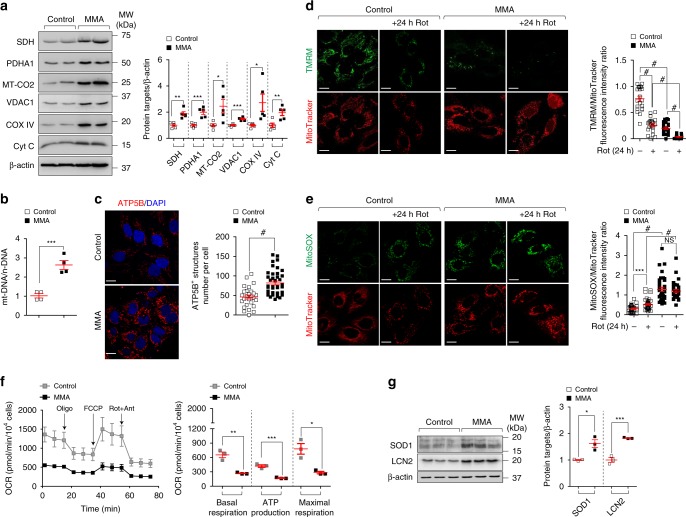
Fig. 2 Mitochondrial dysfunctions in MMA kidney cells.

a Representative immunoblotting and quantification of the indicated mitochondrial proteins; n = 5 biologically independent experiments. b The ratio between mitochondrial DNA (ND1) and nuclear DNA (ACTB) was determined by quantitative PCR; n = 4 biologically independent experiments. c Cells were immunostained for ATP5B (red) and imaged by confocal microscopy. Representative images and quantification of numbers of ATP5B+ structures per cell (n = 27 control cells and n = 40 MMA cells pooled from three biologically independent experiments). Nuclei counterstained with DAPI (blue). d, e Cells were exposed to mitochondrial complex I inhibitor Rotenone (Rot, 5 μM). After 24 h of treatment, the cells were loaded (d) with tetramethylrhodamine methyl ester (TMRM; green; mitochondrial membrane potential fluorescent probe, 50 nM for 30 min at 37 °C) and MitoTracker (red; fluorescent probe that localizes to mitochondria; 1 μM for 30 min at 37 °C) or (e) with MitoSOX (green; mitochondrial ROS indicator, 2.5 μM for 25 min at 37 °C) and MitoTracker (red), and analysed by confocal microscopy. Representative images and quantification of d membrane potential and e mitochondrial ROS (both calculated as ratio between TMRM and MitoTracker or MitoSOX and MitoTracker fluorescence intensities, with each point representing the average fluorescence intensity ratio in a cell). TMRM/MitoTracker: n = 21 untreated and Rot-treated control cells, n = 22 untreated MMA cells and n = 18 Rot-treated MMA cells. MitoSOX/MitoTracker: n = 31 untreated control cells and n = 40 Rot-treated control cells n = 36 untreated MMA cells and n = 31 Rot-treated MMA cells. Values are pooled from three biologically independent experiments. f Oxygen consumption rate (OCR) and individual parameters for basal respiration, ATP production and maximal respiration. OCRs were measured at baseline and after the sequential addition of Oligomycin (Oligo, 1 μM), FCCP (0.5 μM) and Rotenone (Rot; 1 μM) + Antimycin A (Ant; 1 μM), n = 3 biologically independent experiments. g Immunoblotting and quantification of the indicated proteins; n = 3 biologically independent experiments. Plots represent mean ± SEM. Two-tailed Student’s t-test, *P < 0.05, **P < 0.01, ***P < 0.001 and #P < 0.0001 relative to untreated or to Rot-treated control cells or to untreated MMA cells. β-actin was used as a loading control in a and b. Scale bars, 10 μM. NS non-significant. Source data are provided as a Source Data file.

Acknowledgments
This image is the copyrighted work of the attributed author or publisher, and ZFIN has permission only to display this image to its users. Additional permissions should be obtained from the applicable author or publisher of the image. Full text @ Nat. Commun.