IMAGE

Fig. 4

ID
ZDB-IMAGE-200306-88
Source
Figures for Luciani et al., 2020
Image
Figure Caption

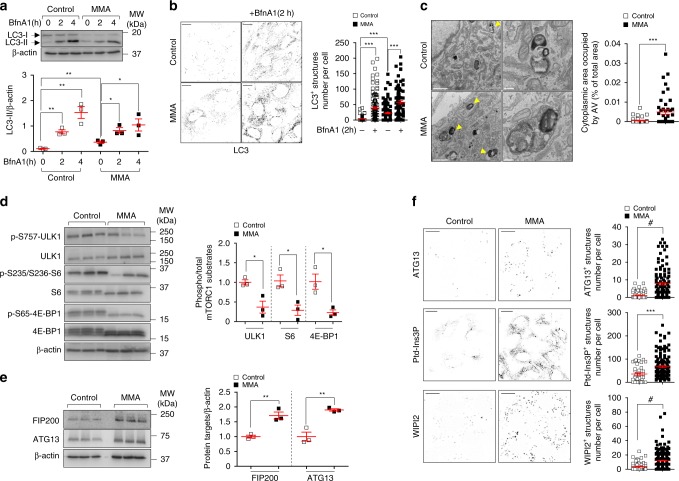
Fig. 4 <italic>MMUT</italic> deficiency stimulates autophagy in MMA kidney cells.

a, b Cultured cells were exposed to lysosome-based proteolysis inhibitor Bafilomycin A1 (BfnA1, 250 nM for the indicated times). Representative immunoblotting and quantification of LC3-II; n = 3 biologically independent experiments. Two-tailed Student’s t-test, *P < 0.05 and **P < 0.01 relative to untreated control or MMA cells. b Representative inverted images and quantification of numbers of punctate LC3+ structures per cell; n = 122 untreated control cells, n = 127 BfnA1-treated control cells, n = 127 untreated MMA cells and n = 77 BfnA1-treated MMA cells. Values are pooled from three biologically independent experiments. One-way ANOVA followed by Bonferroni’s post hoc test, ***P < 0.001 relative to untreated control or MMA cells. c Representative electron micrographs and quantification of cytoplasm area occupied by autophagy vacuoles (AV; expressed as the percentage of the total area); n = 43 control cells and n = 45 MMA cells pooled from two biologically independent experiments. Arrowheads indicate EM-compatible AV. d, e Immunoblotting and quantification of (d) phosphorylated and total forms of mTORC1 substrates and of (e) FIP200 and ATG13, n = 3 biologically independent experiments. f Representative inverted images and quantification of numbers of ATG13+ (top) or Ptd-Ins3P+ (middle) or WIPI2+ (bottom) structures per cell, respectively. Number of ATG13+ structures: n = 86 control cells and n = 118 MMA cells. Number of Ptd-Ins3Pstructures: n = 41 control cells and n = 141 MMA cells. Number of WIPI2+ structures: n = 71 control cells and n = 253 MMA cells. Values are pooled from three biologically independent experiments. Plots represent mean ± SEM. Two-tailed Student’s t-test, *P < 0.05, **P < 0.01, ***P < 0.001 and #P < 0.0001 relative to control cells in cf. β-actin was used as a loading control in a, d and e. Scale bars are 10 μm in b and f, and 1 μm and 250 nm in c (left and right panels, respectively). NS non-significant. Source data are provided as a Source Data file.

Acknowledgments
This image is the copyrighted work of the attributed author or publisher, and ZFIN has permission only to display this image to its users. Additional permissions should be obtained from the applicable author or publisher of the image. Full text @ Nat. Commun.