IMAGE

Fig. 7

ID
ZDB-IMAGE-200306-91
Source
Figures for Luciani et al., 2020
Image
Figure Caption

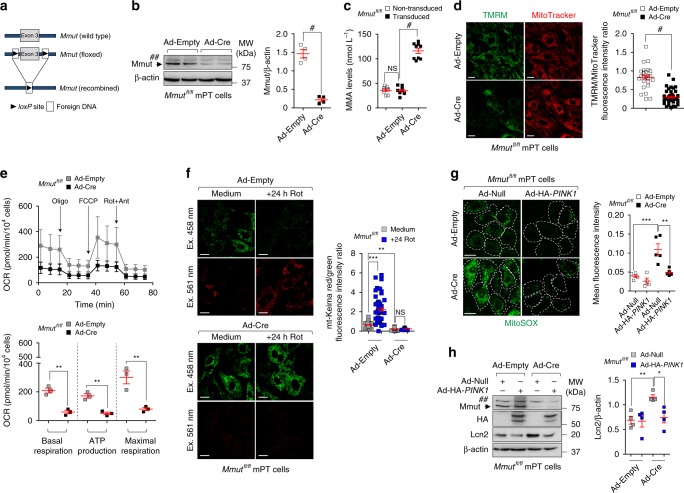
Fig. 7 <italic>MMUT</italic> deletion damages mitochondria and blunts PINK1-directed mitophagy triggering epithelial stress in kidney cells.

ai Mouse proximal tubule (mPT) cells from floxed Mmut kidneys were transduced with adenovirus bearing Empty or Cre-recombinase for 5 days. a Workflow of strategy used to generate the floxed Mmut alleles. b, c Validation of Mmut deletion by b immunoblotting (n = 4 biologically independent experiments) and c by LC-MS/MS analysis of MMA levels (n = 9 replicates pooled from three biologically independent experiments). d Cells were loaded with TMRM (green) and MitoTracker (red). Confocal microscopy-based quantification of fluorescence intensity ratio in a cell. Number of cells transduced with Ad-Empty (n = 25) or Ad-Cre (n = 45). e Oxygen consumption rate (OCR) and individual parameters for basal respiration, ATP production and maximal respiration. OCRs were measured at baseline and after the sequential addition of Oligomycin (Oligo, 1 μM), FCCP (0.5 μM) and Rotenone (Rot, 1 μM) + Antimycin A (Ant, 1 μM). fMmut cells were transduced with adenovirus expressing mitochondrially targeted form of Keima (mt-Keima) for 24 h and exposed to Rotenone (Rot, 5 μM for 24 h). Representative images and quantification of red/green fluorescence intensity ratio in a cell. Number of untreated (n = 68) and Rot-treated (n = 57) control cells, and number of untreated (n = 51) and Rot-treated (n = 58) Mmut-deleted cells. g, h Control and Mmut-deleted cells were transduced with adenovirus expressing Null or HA-PINK1 for 24 h. g Cells were loaded with MitoSOX (green) and analysed by confocal microscopy. Representative images and quantification of MitoSOX fluorescence intensity, n ≥ 4 randomly selected and non-overlapping fields of views per condition, with each containing ~10 cells. h Representative immunoblotting and quantification of Lcn2, n = 4 biologically independent experiments. β-actin was used as a loading control. Values in dg are pooled from three biologically independent experiments. Plots represent mean ± SEM. Asterisks denote non-specific bands in b and h. Two-tailed Student’s t-test, *P < 0.05, **P < 0.01, ***P < 0.01 and #P < 0.0001 relative to control cells in be or relative to control or Mmut-deleted cells transduced with Ad-Null in h. One-way ANOVA followed by Bonferroni’s post hoc test, **P < 0.01 and ***P < 0.001 relative to untreated control cells or relative to control or Mmut-deleted cells transduced with Ad-Null in f and g. Scale bars,10 μm. NS non-significant. Source data are provided as a Source Data file.

Acknowledgments
This image is the copyrighted work of the attributed author or publisher, and ZFIN has permission only to display this image to its users. Additional permissions should be obtained from the applicable author or publisher of the image. Full text @ Nat. Commun.