FIGURE SUMMARY
Title

Granulins Regulate Aging Kinetics in the Adult Zebrafish Telencephalon

Authors
Zambusi, A., Pelin Burhan, Ö., Di Giaimo, R., Schmid, B., Ninkovic, J.
Source
Full text @ Cells

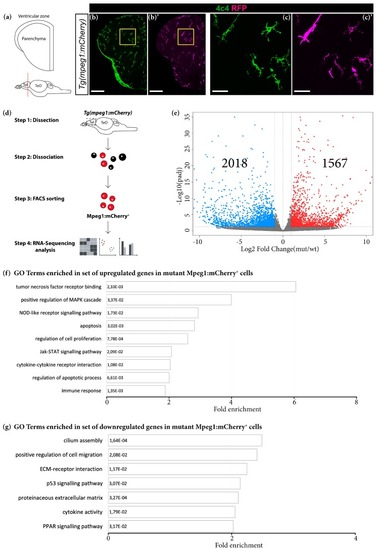
Grna and Grnb deficiency leads to transcriptional changes associated with an activated microglial state. (a) Schematic of a typical section from the adult zebrafish telencephalon. (bc′) Micrographs depicting microglial cells in the telencephalon in Tg (mpeg1:mCherry) animals. (c,c′) Magnifications of areas boxed in (b) and (b′), respectively. Scale bars: 100 µm (b,b′) and 20 µm (c,c′). (d) Scheme depicting the isolation procedure of Mpeg1+ cells for transcriptome analysis. (e) Volcano plot of differentially expressed genes (DEGs) in mutant Mpeg1+ cells (padj ≤ 0.05; 1 ≤ log2FC ≤ −1). (f,g) Histograms depicting gene ontology (GO) terms enriched in the set of upregulated (f) and downregulated (g) genes in mutant Mpeg1+ cells.

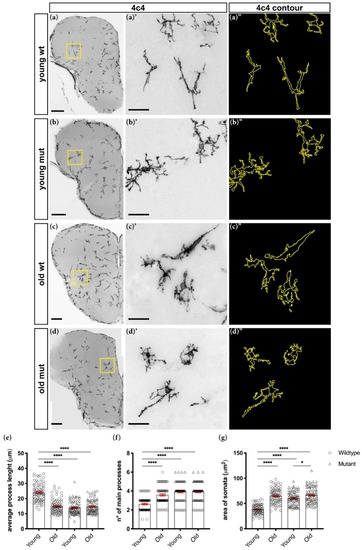
Grna; Grnb-deficient microglial cells display morphological changes associated with aging. (ad) Micrographs depicting 4C4+ microglial cells. (a′d′) Magnifications of boxed areas in (ad), respectively. (a″d″) Morphological tracing of 4C4+ microglial cells. Scale bars: 100 µm (ad magnification) and 20 µm (a′d′). (eg) Morphological analysis depicting the average process length (e), number of main processes (f) and area of somata (g) of 4C4+ microglial cells. n.s, not significant, * p ≤ 0.05, **** p ≤ 0.0001, each data point represents a single cell (a total of 80 cells from four telencephali were analysed in each group).

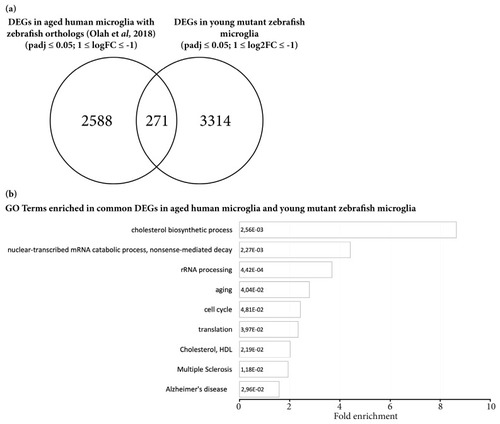
Microglial cells isolated from young mutant zebrafish share a proportion of DEGs with aging human microglial cells. (a) Venn diagram depicting common DEGs in aging human microglial cells with existing zebrafish orthologs and in young mutant zebrafish Mpeg1+ cells. (b) Histograms depicting gene ontology (GO) terms enriched in the set of 271 common DEGs in aging human and young mutant zebrafish microglial cells.

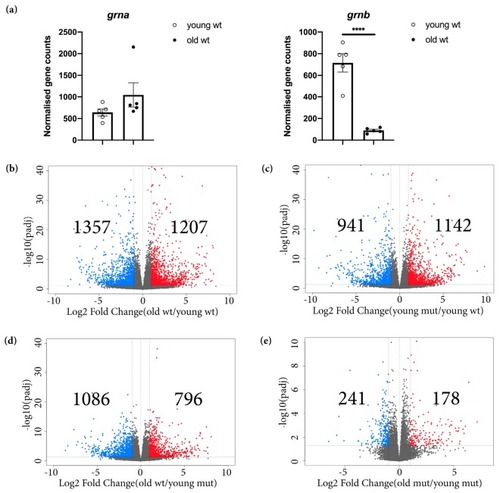
Transcriptomic changes detected in old wildtype, young mutant, and old mutant telencephali. (a) Normalised gene counts of grna and grnb in young and old wildtype animals. **** padj ≤ 0.0001, each data point represents a distinct biological replicate (five telencephali per group were analysed). (b) Volcano plot of DEGs in old wildtype animals (young wildtype animals were used as a reference) (padj ≤ 0.05; 1 ≤ log2FC ≤ −1). (c) Volcano plot of DEGs in young mutant animals (young wildtype animals were used as a reference) (padj ≤ 0.05; 1 ≤ log2FC ≤ −1). (d) Volcano plot of DEGs in old wildtype animals (young mutant animals were used as a reference) (padj ≤ 0.05; 1 ≤ log2FC ≤ −1). (e) Volcano plot of DEGs in old mutant animals (young mutant animals were used as a reference) (padj ≤ 0.05; 1 ≤ log2FC ≤ −1).

EXPRESSION / LABELING:
Genes:
Fish:
Anatomical Term:
Stage: Adult

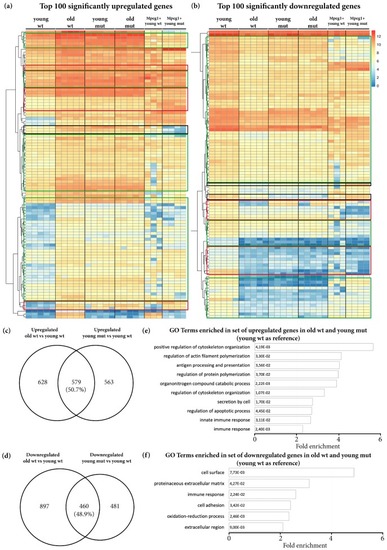
The phenotype of age-related transcriptional changes detected in old wildtype animals is partially mimicked by Grna and Grnb deficiency in young mutant animals. (a,b) Heat maps depicting rlog-transformed values of the top 100 significantly upregulated and downregulated genes in old wildtype telencephali (young wildtype were used as a reference) in young wildtype animals, old wildtype animals, young mutant animals, old mutant animals, young wildtype Mpeg1+ cells, and young mutant Mpeg1+ cells. Green boxes: DEGs in old wildtype animals with the same direction of regulation in young mutant and old mutant animals, but not regulated in mutant microglial Mpeg1+ cells. Red boxes: DEGs in old wildtype animals with comparable levels in young mutant and old mutant animals, regulated in the same direction in mutant microglial Mpeg1+ cells. Black boxes: DEGs in old wildtype animals with comparable values in young mutant and old mutant animals, regulated in the opposite direction in mutant microglial Mpeg1+ cells. (c,d) Venn diagrams depicting common DEGs in old wildtype and young mutant telencephali (young wildtype were used as a reference). (e,f) Histograms depicting gene ontology (GO) terms enriched in the set of common upregulated and downregulated genes in old wildtype and young mutant telencephali (young wildtype were used as a reference).

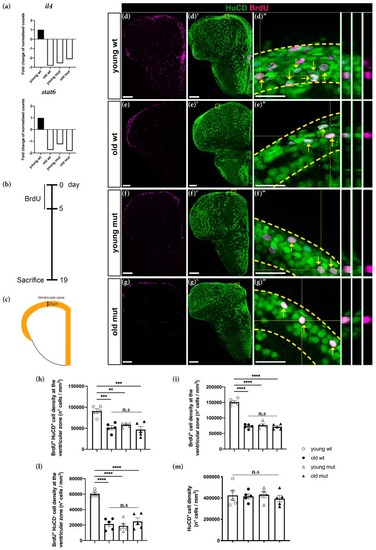
Grna and Grnb deficiency mimics the phenotype of the decrease in neurogenesis observed during aging in the adult zebrafish telencephalon. (a) Histograms depicting relative expression (normalised to that in young wildtype animals) of il4 and stat6. (b) Experimental scheme to assess neurogenesis. (c) Schematic of a typical section from the adult zebrafish telencephalon. Orange area: ventricular area analysed in the experiment. (dg″) Micrographs depicting newly generated neurons (arrow). (d″g″) Magnifications with orthogonal projections of boxed areas in (d′g′), respectively. Scale bars: 100 µm (dg′) and 20 µm (d″g″). (hl) Histograms depicting the density of newly generated neurons (h), BrdU+ cells (i), and density of non-neuronal BrdU-label retaining cells (l) in the ventricular zone of the adult zebrafish telencephalon. (m) Histogram depicting the density of total HuCD+ neurons. n.s, not significant, ** p ≤ 0.01, *** p ≤ 0.001, **** p ≤ 0.0001, each data point represents a distinct biological replicate (five telencephali per group were analysed).

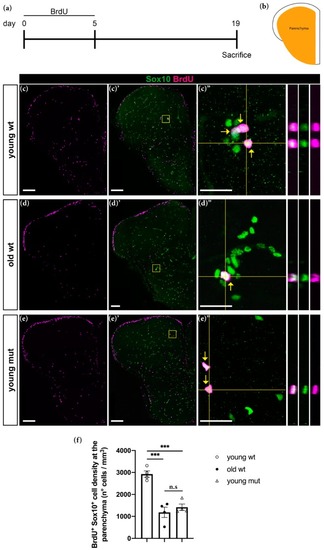
Grna; Grnb deficiency mimics the phenotype of the decrease in oligodendrogenesis observed during aging in the adult zebrafish telencephalon. (a) Experimental scheme. (b) Schematic of a typical section from the adult zebrafish telencephalon. Orange area: parenchymal area analysed in the experiment. (ce″) Micrographs depicting BrdU positive oligodendroglial cells stained with Sox10 (green). (c″e″) Magnifications with orthogonal projections of boxed areas in (c′e′), respectively. Yellow arrows depict cells positive for Sox10 and BrdU. Scale bars: 100 µm in (ce′) and 20 µm in (c″e″). (f) Histogram depicting the density of BrdU+ Sox10+ cells in the parenchyma. n.s, not significant, *** p ≤ 0.001, each data point represents a distinct biological replicate (four telencephali per group were analysed).

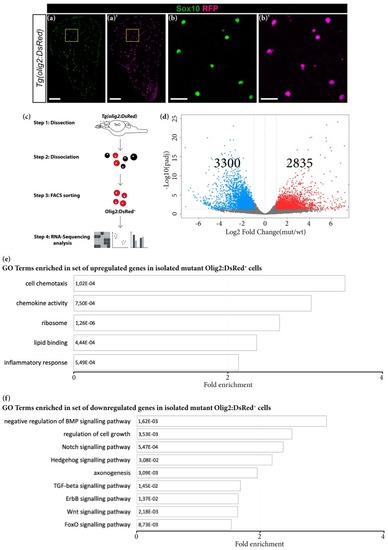
Transcriptomic changes in FACS-isolated mutant oligodendroglial cells. (ab′) Micrographs showing perfect co-localisation of DsRed in the Tg (olig2:DsRed) line with the oligodendrocyte lineage marker Sox10. (b,b′) Magnifications of the boxed areas in (a) and (a′), respectively. Scale bars: 100 µm in (a,a′) and 20 µm in (b,b′). (c) Scheme depicting isolation procedure of Olig2+ cells for transcriptome analysis. (d) Volcano plot of differentially regulated genes in mutant Olig2+ cells (padj ≤ 0.05; 1 ≤ log2FC ≤ −1). (e,f) Histograms depicting gene ontology (GO) terms enriched in the set of upregulated (e) and downregulated (f) genes in mutant Olig2+ cells.

Grna and Grnb deficiency causes downregulation of telomere-protective genes and telomere shortening in the telencephalon in young zebrafish, as observed in old animals. (a) Histogram depicting normalised gene counts of tert, tp53, and tpp1. (b) Histogram depicting relative telomere length in the young wildtype, old wildtype, young mutant, and old mutant zebrafish telencephalon. n.s not significant, * padj ≤ 0.05, ** padj ≤ 0.01, *** padj ≤ 0.001, **** padj ≤ 0.0001, each data point represents a distinct biological replicate (five telencephali per group were analysed).

Acknowledgments
This image is the copyrighted work of the attributed author or publisher, and ZFIN has permission only to display this image to its users. Additional permissions should be obtained from the applicable author or publisher of the image. Full text @ Cells