IMAGE

Figure 6

ID
ZDB-IMAGE-200325-44
Genes
Source
Figures for Zambusi et al., 2020
Image
Figure Caption

Figure 6

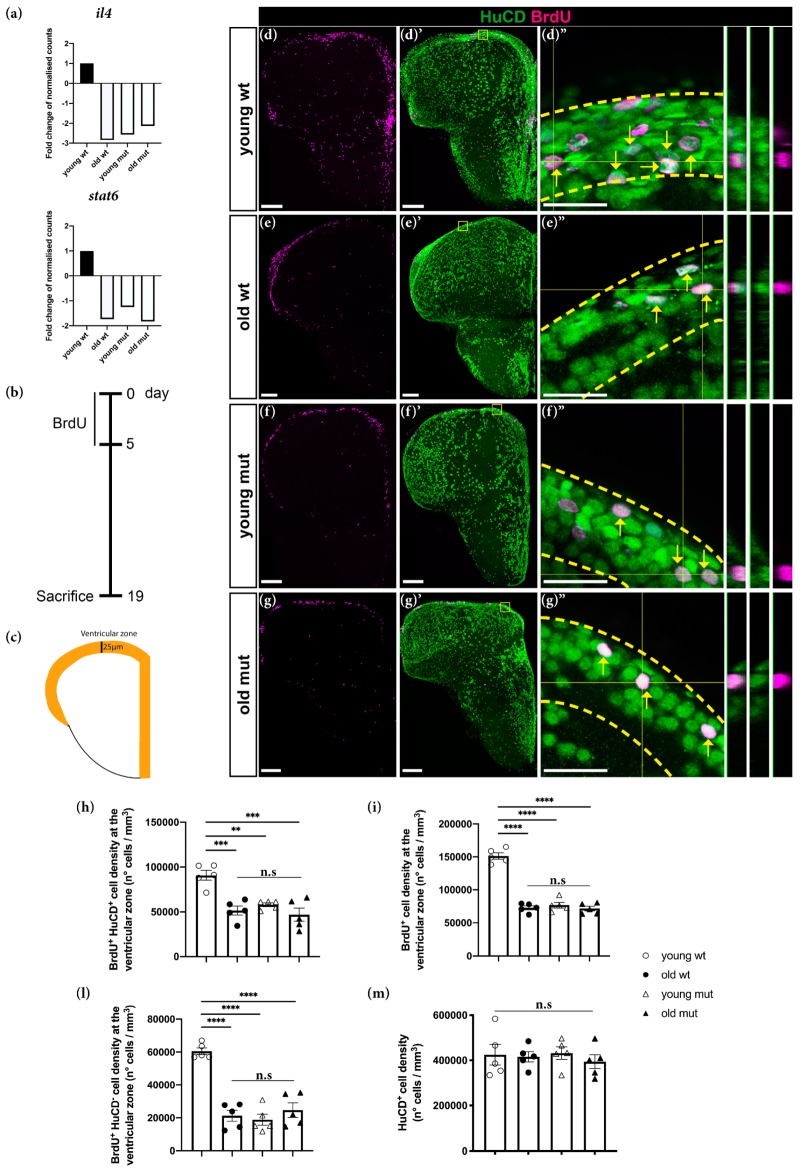
Grna and Grnb deficiency mimics the phenotype of the decrease in neurogenesis observed during aging in the adult zebrafish telencephalon. (a) Histograms depicting relative expression (normalised to that in young wildtype animals) of il4 and stat6. (b) Experimental scheme to assess neurogenesis. (c) Schematic of a typical section from the adult zebrafish telencephalon. Orange area: ventricular area analysed in the experiment. (dg″) Micrographs depicting newly generated neurons (arrow). (d″g″) Magnifications with orthogonal projections of boxed areas in (d′g′), respectively. Scale bars: 100 µm (dg′) and 20 µm (d″g″). (hl) Histograms depicting the density of newly generated neurons (h), BrdU+ cells (i), and density of non-neuronal BrdU-label retaining cells (l) in the ventricular zone of the adult zebrafish telencephalon. (m) Histogram depicting the density of total HuCD+ neurons. n.s, not significant, ** p ≤ 0.01, *** p ≤ 0.001, **** p ≤ 0.0001, each data point represents a distinct biological replicate (five telencephali per group were analysed).

Figure Data
Acknowledgments
This image is the copyrighted work of the attributed author or publisher, and ZFIN has permission only to display this image to its users. Additional permissions should be obtained from the applicable author or publisher of the image. Full text @ Cells