IMAGE

Figure 5

ID
ZDB-IMAGE-200325-42
Source
Figures for Zambusi et al., 2020
Image
Figure Caption

Figure 5

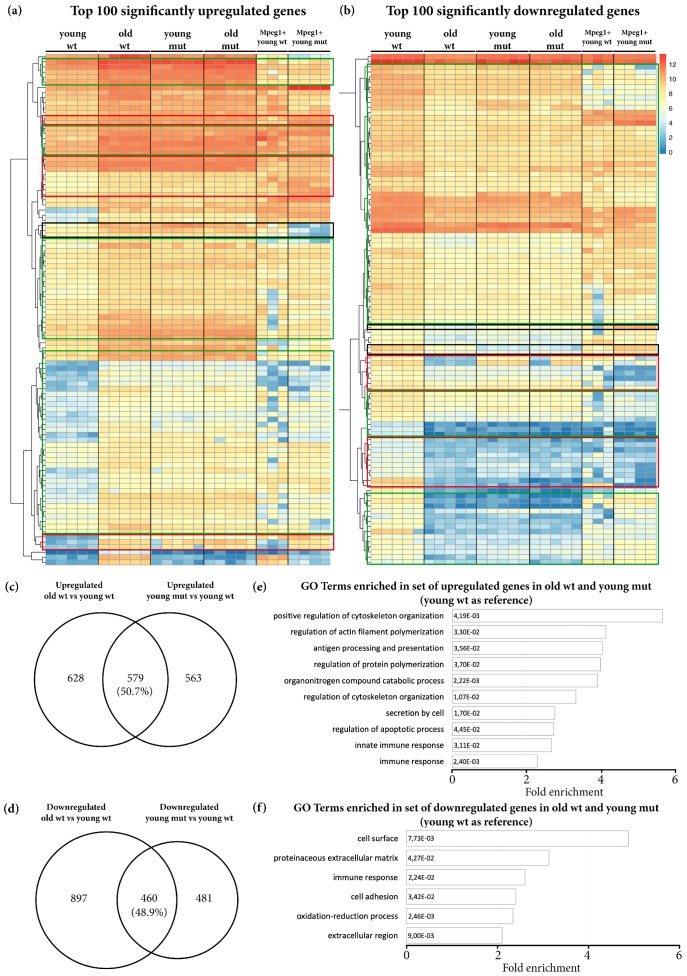
The phenotype of age-related transcriptional changes detected in old wildtype animals is partially mimicked by Grna and Grnb deficiency in young mutant animals. (a,b) Heat maps depicting rlog-transformed values of the top 100 significantly upregulated and downregulated genes in old wildtype telencephali (young wildtype were used as a reference) in young wildtype animals, old wildtype animals, young mutant animals, old mutant animals, young wildtype Mpeg1+ cells, and young mutant Mpeg1+ cells. Green boxes: DEGs in old wildtype animals with the same direction of regulation in young mutant and old mutant animals, but not regulated in mutant microglial Mpeg1+ cells. Red boxes: DEGs in old wildtype animals with comparable levels in young mutant and old mutant animals, regulated in the same direction in mutant microglial Mpeg1+ cells. Black boxes: DEGs in old wildtype animals with comparable values in young mutant and old mutant animals, regulated in the opposite direction in mutant microglial Mpeg1+ cells. (c,d) Venn diagrams depicting common DEGs in old wildtype and young mutant telencephali (young wildtype were used as a reference). (e,f) Histograms depicting gene ontology (GO) terms enriched in the set of common upregulated and downregulated genes in old wildtype and young mutant telencephali (young wildtype were used as a reference).

Acknowledgments
This image is the copyrighted work of the attributed author or publisher, and ZFIN has permission only to display this image to its users. Additional permissions should be obtained from the applicable author or publisher of the image. Full text @ Cells