FIGURE

Figure 8

ID
ZDB-FIG-200325-41
Publication
Zambusi et al., 2020 - Granulins Regulate Aging Kinetics in the Adult Zebrafish Telencephalon
Other Figures
All Figure Page
Back to All Figure Page
Figure 8

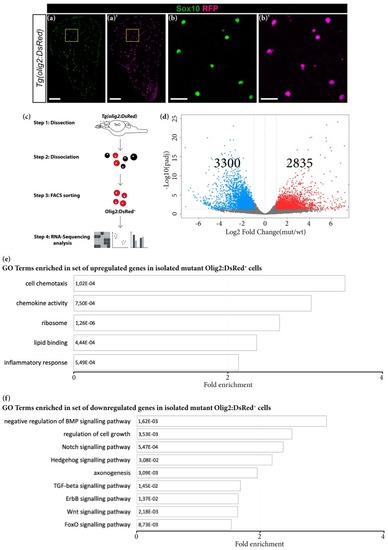
Transcriptomic changes in FACS-isolated mutant oligodendroglial cells. (ab′) Micrographs showing perfect co-localisation of DsRed in the Tg (olig2:DsRed) line with the oligodendrocyte lineage marker Sox10. (b,b′) Magnifications of the boxed areas in (a) and (a′), respectively. Scale bars: 100 µm in (a,a′) and 20 µm in (b,b′). (c) Scheme depicting isolation procedure of Olig2+ cells for transcriptome analysis. (d) Volcano plot of differentially regulated genes in mutant Olig2+ cells (padj ≤ 0.05; 1 ≤ log2FC ≤ −1). (e,f) Histograms depicting gene ontology (GO) terms enriched in the set of upregulated (e) and downregulated (f) genes in mutant Olig2+ cells.

Expression Data

Expression Detail
Antibody Labeling
Phenotype Data

Phenotype Detail
Acknowledgments
This image is the copyrighted work of the attributed author or publisher, and ZFIN has permission only to display this image to its users. Additional permissions should be obtained from the applicable author or publisher of the image. Full text @ Cells