
Image
|
Figure Caption
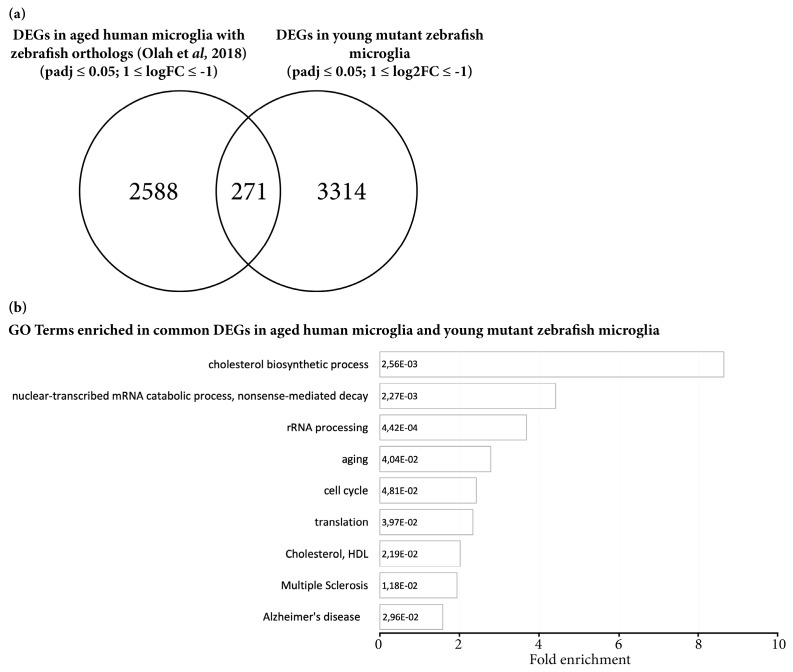
Figure 3
Microglial cells isolated from young mutant zebrafish share a proportion of DEGs with aging human microglial cells. (
Acknowledgments
This image is the copyrighted work of the attributed author or publisher, and
ZFIN has permission only to display this image to its users.
Additional permissions should be obtained from the applicable author or publisher of the image.
Full text @ Cells