IMAGE

Figure 1

ID
ZDB-IMAGE-200325-38
Source
Figures for Zambusi et al., 2020
Image
Figure Caption

Figure 1

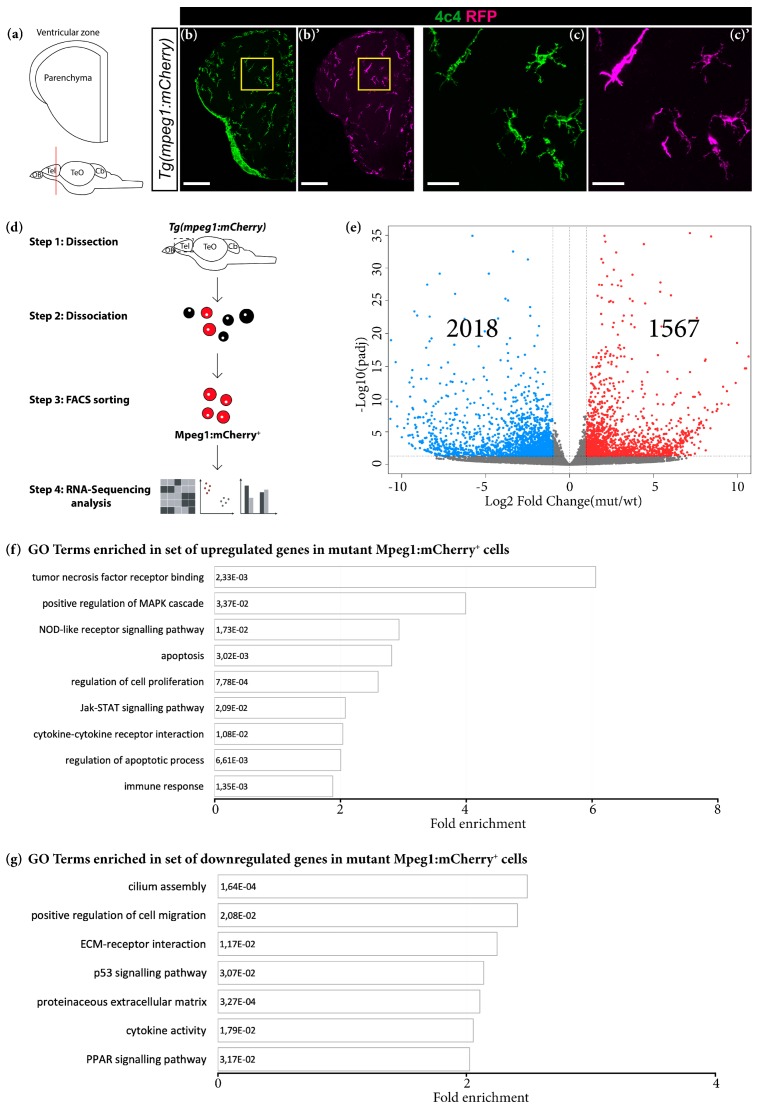
Grna and Grnb deficiency leads to transcriptional changes associated with an activated microglial state. (a) Schematic of a typical section from the adult zebrafish telencephalon. (bc′) Micrographs depicting microglial cells in the telencephalon in Tg (mpeg1:mCherry) animals. (c,c′) Magnifications of areas boxed in (b) and (b′), respectively. Scale bars: 100 µm (b,b′) and 20 µm (c,c′). (d) Scheme depicting the isolation procedure of Mpeg1+ cells for transcriptome analysis. (e) Volcano plot of differentially expressed genes (DEGs) in mutant Mpeg1+ cells (padj ≤ 0.05; 1 ≤ log2FC ≤ −1). (f,g) Histograms depicting gene ontology (GO) terms enriched in the set of upregulated (f) and downregulated (g) genes in mutant Mpeg1+ cells.

Acknowledgments
This image is the copyrighted work of the attributed author or publisher, and ZFIN has permission only to display this image to its users. Additional permissions should be obtained from the applicable author or publisher of the image. Full text @ Cells