
- Title
-
MicroRNA-223 Suppresses the Canonical NF-κB Pathway in Basal Keratinocytes to Dampen Neutrophilic Inflammation
- Authors
- Zhou, W., Pal, A.S., Hsu, A.Y., Gurol, T., Zhu, X., Wirbisky-Hershberger, S.E., Freeman, J.L., Kasinski, A.L., Deng, Q.
- Source
- Full text @ Cell Rep.
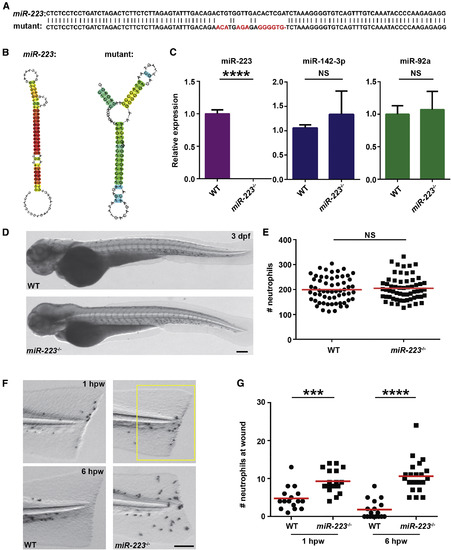
miR-223-Deficient Embryos Display Augmented Neutrophil Response to Tissue Injury (A) Sequences of pre-mir-223 in WT and miR-223 mutant embryos. Mutated nucleotides are labeled in red. (B) The hairpin structures of miR-223 in WT and mutant embryos predicted by Centroidfold. (C) Expression of miR-223, miR-142-3p, and miR-92a in WT and miR-223−/− embryos determined by qRT-PCR. (D and E) Representative images (D) and quantification (E) of total neutrophil numbers in WT and miR-223−/− embryos. (F and G) Representative images (F) and quantification (G) of neutrophil recruitment to tail transection sites in WT and miR-223−/− embryos at 1 hpw and 6 hpw. The number of neutrophils in the boxed region were quantified. Scale bars, 100 μm. Data are representative of three independent experiments (E and G) or are pooled from three independent experiments (C). Mean ± SD. ∗∗∗p < 0.001 and ∗∗∗∗p < 0.0001, unpaired Student’s t test. See also Figures S1 and S2. PHENOTYPE:
|

Neutrophil-Intrinsic miR-223 Regulates Neutrophilic Inflammation (A) Schematics of Tol2-lyzC-Gal4-crys-CFP construct, injected into WT embryos to generate the transgenic line Tg(lyzC:Gal4-Vp16, crys:CFP)pu8; Tol2-UAS-miR-223 sponge that contains 6 bulged miR-223 binding sites after the UAS element and the Dendra2 control plasmid. (B and C) miR-223 sponge or Dendra2 control plasmids in (A) were injected into embryos from Tg(lyzC: Gal4-Vp16, crys:CFP)pu8 and Tg(lyzC: mCherry-H2B) cross. Tailfins were transected at 3 dpf. Representative images at indicating time points are shown in (B), and neutrophil recruitment at 6 hpw is shown in (C). (D) Schematics of Tol2-lyzC-miR-223/RFP constructs, injected into WT embryos to generate the transgenic line Tg(lyzC: RFP-miR-223)pu9 and the control line Tg(lyzC: RFP)pu10. (E) The transgenic lines illustrated in (D) were crossed into the miR-223−/− background. The siblings without RFP were used as negative control. miR-223 expression in indicated groups was quantified by qRT-PCR (mean ± SD). (F and G) Quantification of neutrophil recruitment to tail transection sites in embryos with miR-223 (F) or RFP control (G) expressed in neutrophils in the miR-223−/− background at 1 hpw and 6 hpw. Scale bars, 100 μm. One representative experiment of three independent repeats is shown. ∗p < 0.05, ∗∗p < 0.01, ∗∗∗p < 0.001, and ∗∗∗∗p < 0.0001, unpaired Student’s t test (C, F, and G) or one-way ANOVA (E). See also Movie S1. PHENOTYPE:
|

ZFIN is incorporating published figure images and captions as part of an ongoing project. Figures from some publications have not yet been curated, or are not available for display because of copyright restrictions. EXPRESSION / LABELING:
PHENOTYPE:
|
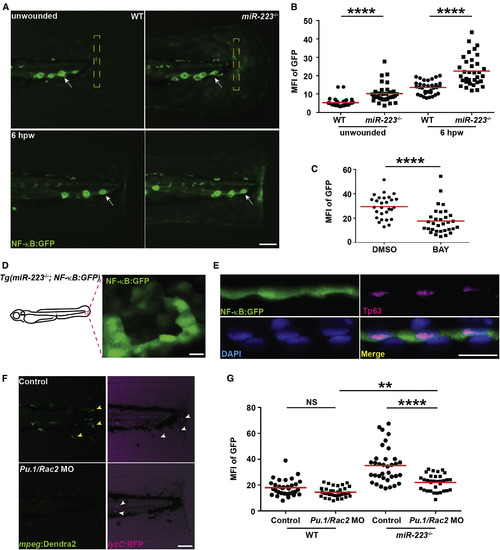
NF-κB Pathway Is Elevated in Basal Epithelial Cells in miR-223−/− Embryos The NF-κB reporter line Tg(NF-κB:GFP) was crossed into the miR-223−/− and matched WT background. (A and B) Representative images (A) and quantification (B) of GFP signal. Mean fluorescence intensity (MFI) in the yellow square (A) in unwounded embryos or at the wound edge at 6 hpw was quantified. White arrows, neuromast cells constitutively expressing NF-κB signal. (C) Quantification of GFP signal at the wound edge at 6 hpw in miR-223−/− embryos treated with DMSO or BAY. (D) Representative confocal image of GFP+ cells in miR-223−/− embryos. (E) Immunofluorescence of GFP and Tp63 (basal cell marker) in Tg(miR-223−/−, NF-κB:GFP) embryos. Nucleus were stained with DAPI. Representative confocal images of vertical view are shown in (E). (F and G) Embryos from WT and miR-223−/− were injected with Pu.1 (200 μM) and Rac2 (100 μM) morpholinos. (F). Representative images showing the efficiency of the two morpholinos. Yellow arrowhead, macrophage; white arrowhead, neutrophils. (G) Quantification of GFP signal at the wound edge at 6 hpw in WT and miR-223−/− embryos. Scale bars, 100 μm (A and F), 20 μm (D and E). Data are representative of three independent experiments. ∗∗p < 0.01 and ∗∗∗∗p < 0.0001, unpaired Student’s t test (B and C) or two-way ANOVA (G). See also Figure S6 and Movie S2. EXPRESSION / LABELING:
PHENOTYPE:
|
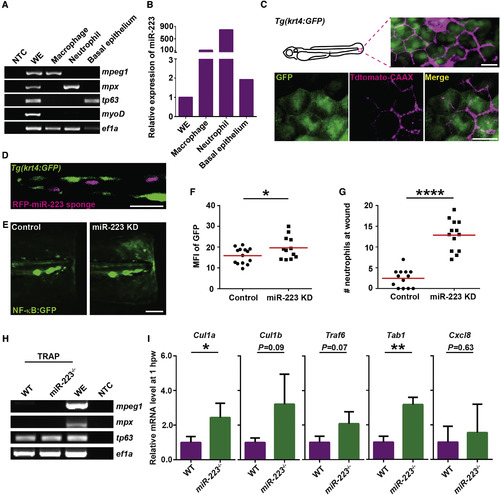
miR-223 Suppresses NF-κB Activation in Basal Epithelial Cells in a Cell-Intrinsic Manner (A and B) Macrophages, neutrophils, and basal epithelial cells were sorted from 3 dpf embryos. (A) RT-PCR of lineage-specific markers. mpeg, macrophage marker; mpx, neutrophil marker; tp63, basal epithelial cell marker; myoD, muscle cell marker; ef1a, loading control; WE, whole embryo; NTC, non-template control. (B) qRT-PCR of miR-223. (C) Tdtomato-CAAX mRNA was injected into Tg(krt4: GFP)pu11 embryos at 4-cell stage. Representative confocal images from the lateral view of 3 dpf larvae are shown. (D) RFP-miR-223 sponge mRNA was injected into Tg(krt4: GFP)pu11 embryos at 4-cell stage. A representative confocal image from the vertical view of 2 dpf larvae is shown. (E and F) Tg(NF-κB:GFP) were injected with miR-223 sponge or the RFP control mRNA at 4-cell stage. Representative images and quantification of GFP signal at the wound edge at 6 hpw are shown. (G) Quantification of neutrophil recruitment to the wound in embryos injected with miR-223 sponge or RFP mRNA at 4-cell stage. (H and I) Tol2-tp63-GFP-L10a was injected into WT or miR-223−/− embryos. At 3 dpf, cell-specific mRNA-ribosome complexes were isolated by anti-GFP antibodies at 1 hpw. (H) RT-PCR of lineage-specific markers as described in (A). (I) Real-time qPCR of indicated genes. Data are pooled from three independent experiments (mean + SD). Scale bars, 20 um (C and D), 100 μm (E). Data are representative of three independent experiments (F and G) or of two independent experiments (A and B). ∗p < 0.05, ∗∗p < 0.01, and ∗∗∗∗p < 0.0001, unpaired Student’s t test. EXPRESSION / LABELING:
|
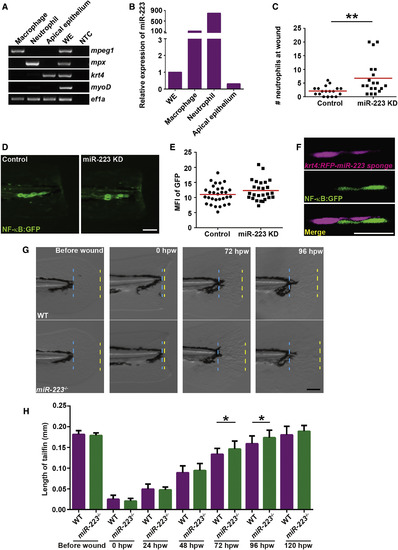
Fin Regeneration Is Accelerated in miR-223-Deficient Embryos (A) Apical epithelial cell were sorted from the Tg(krt4:GFP)pu11 and RT-PCR of lineage-specific markers were performed as described in Figure 5A. krt4, apical epithelial cell marker. (B) Real-time qPCR of miR-223. (C) Quantification of neutrophil recruitment at 6 hpw in embryos from Tg(krt4: RFP-miR-223 sponge)pu12 and Tg(krt4: RFP)pu13. (D and E) Tg(krt4: RFP-miR-223 sponge)pu12 and Tg(krt4: RFP)pu13 were crossed with Tg(NF-κB:GFP). Representative images and quantification of GFP signal at the wound edge at 6 hpw. (F) Representative confocal images of embryos from Tg(NF-κB:GFP/krt4: RFP-miR-223 sponge)pu12 at 6 hpw. (G and H) Tailfin regeneration in WT and miR-223−/− embryos. Tailfin transection was performed at 3 dpf. The length of regenerated tailfin was measured as the distance between the blue and yellow dash lines. (G) Representative images of tailfins at indicated time points. (H) Quantification of the length of tailfin at different time points (mean ± SD; n > 20 in each group). Scale bars, 100 μm (D and G), 20 um (F). Data are representative of three independent experiments (C, E, and H) or of two independent experiments (A and B). ∗p < 0.05, ∗∗p < 0.01, and ∗∗∗∗p < 0.0001, unpaired Student’s t test. EXPRESSION / LABELING:
PHENOTYPE:
|
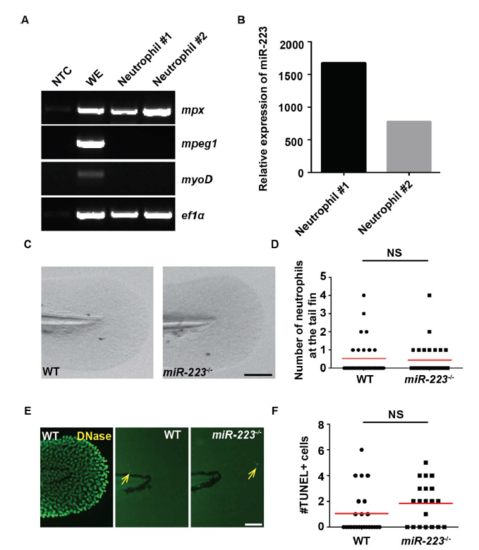
miR-223 deficiency does not lead to cell death in zebrafish, related to Figure 1. Neutrophils were isolated by fluorescence-activated cell sorting from 3 dpf zebrafish embryos. (A) RT-PCR of indicated cell markers. mpeg: macrophage marker; mpx: neutrophil marker; myoD: muscle cell marker; ef1a: loading control. WE: whole embryo. NTC: non-template control. (B) RT-qPCR of miR-223 expression in neutrophils, presented as the relative expression to whole embryos normalized to U6. Two individual experiments are shown. (C) Representative images and (D) Quantification of the neutrophil numbers in the fin in WT and miR-223-/- embryos. One representative experiment of three independent repeats is shown. NS, P > 0.05, unpaired student t-test. (E, F) Representative images of TUNEL staining and quantification of TUNEL+ cells in the fin in WT and miR-223-/- embryos. WT embryos treated with DNase I were used as the positive control. Yellow arrows indicate TUNEL+ cells. Scale bars, 100 μm. NS: P > 0.05, unpaired student t-test. |
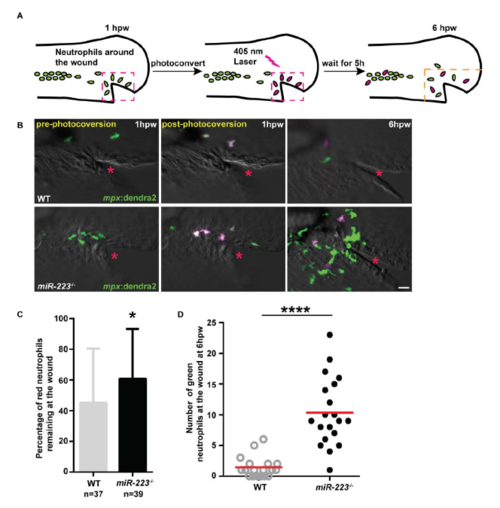
Enhanced neutrophil recruitment in miR-223-/- embryos results from both continuous neutrophil recruitment and a defect in neutrophil reverse migration, related to Figure 1. (A) Schematics of photoconversion-enabled neutrophil fate-mapping assay. Embryos from Tg(miR-223-/-, mpx: Dendra2) or Tg(mpx: Dendra2) were used. Photolabled neutrophils remaining at the wound indicate a defect in reverse migration. (B) Representative confocal images of embryos at three time points: before, immediately after, and 5 hours after photoconversion. Red neutrophils are photoconverted neutrophils. Red star indicates the injury site. (C) Percentage of red neutrophils remaining at the wound at 6 hpw. (D) Quantification of the number of green neutrophils at the wound at 6 hpw. Scale bars, 20 μm. * P < 0.05 and **** P < 0.0001, unpaired student t-test. |
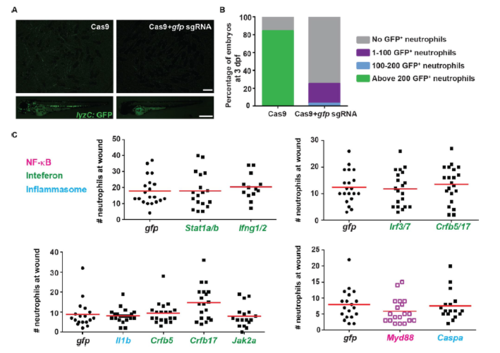
Myd88 knock out rescues over-inflammation in miR-223-/- embryos, related to Figure 3. (A, B) Representative images and quantification of efficiency of transient knock out of GFP using the CRISPR/Cas system. Single guide RNAs targeting GFP were injected into embryos from Tg(lyzC: GFP) together with Cas9 proteins, or Cas9 protein alone. The number of green neutrophils at 3 dpf was counted. (C) CRISPR screening. Two separate sgRNAs were designed for each gene. Pooled sgRNAs targeting one gene or two genes were injected with Cas9 protein into miR-223-/- embryos. Neutrophil recruitment to the wound at 6 hpw was quantified using gfp sgRNA as a control. Genes in the three pathways were color coded separately. |