
|
Fig. 2
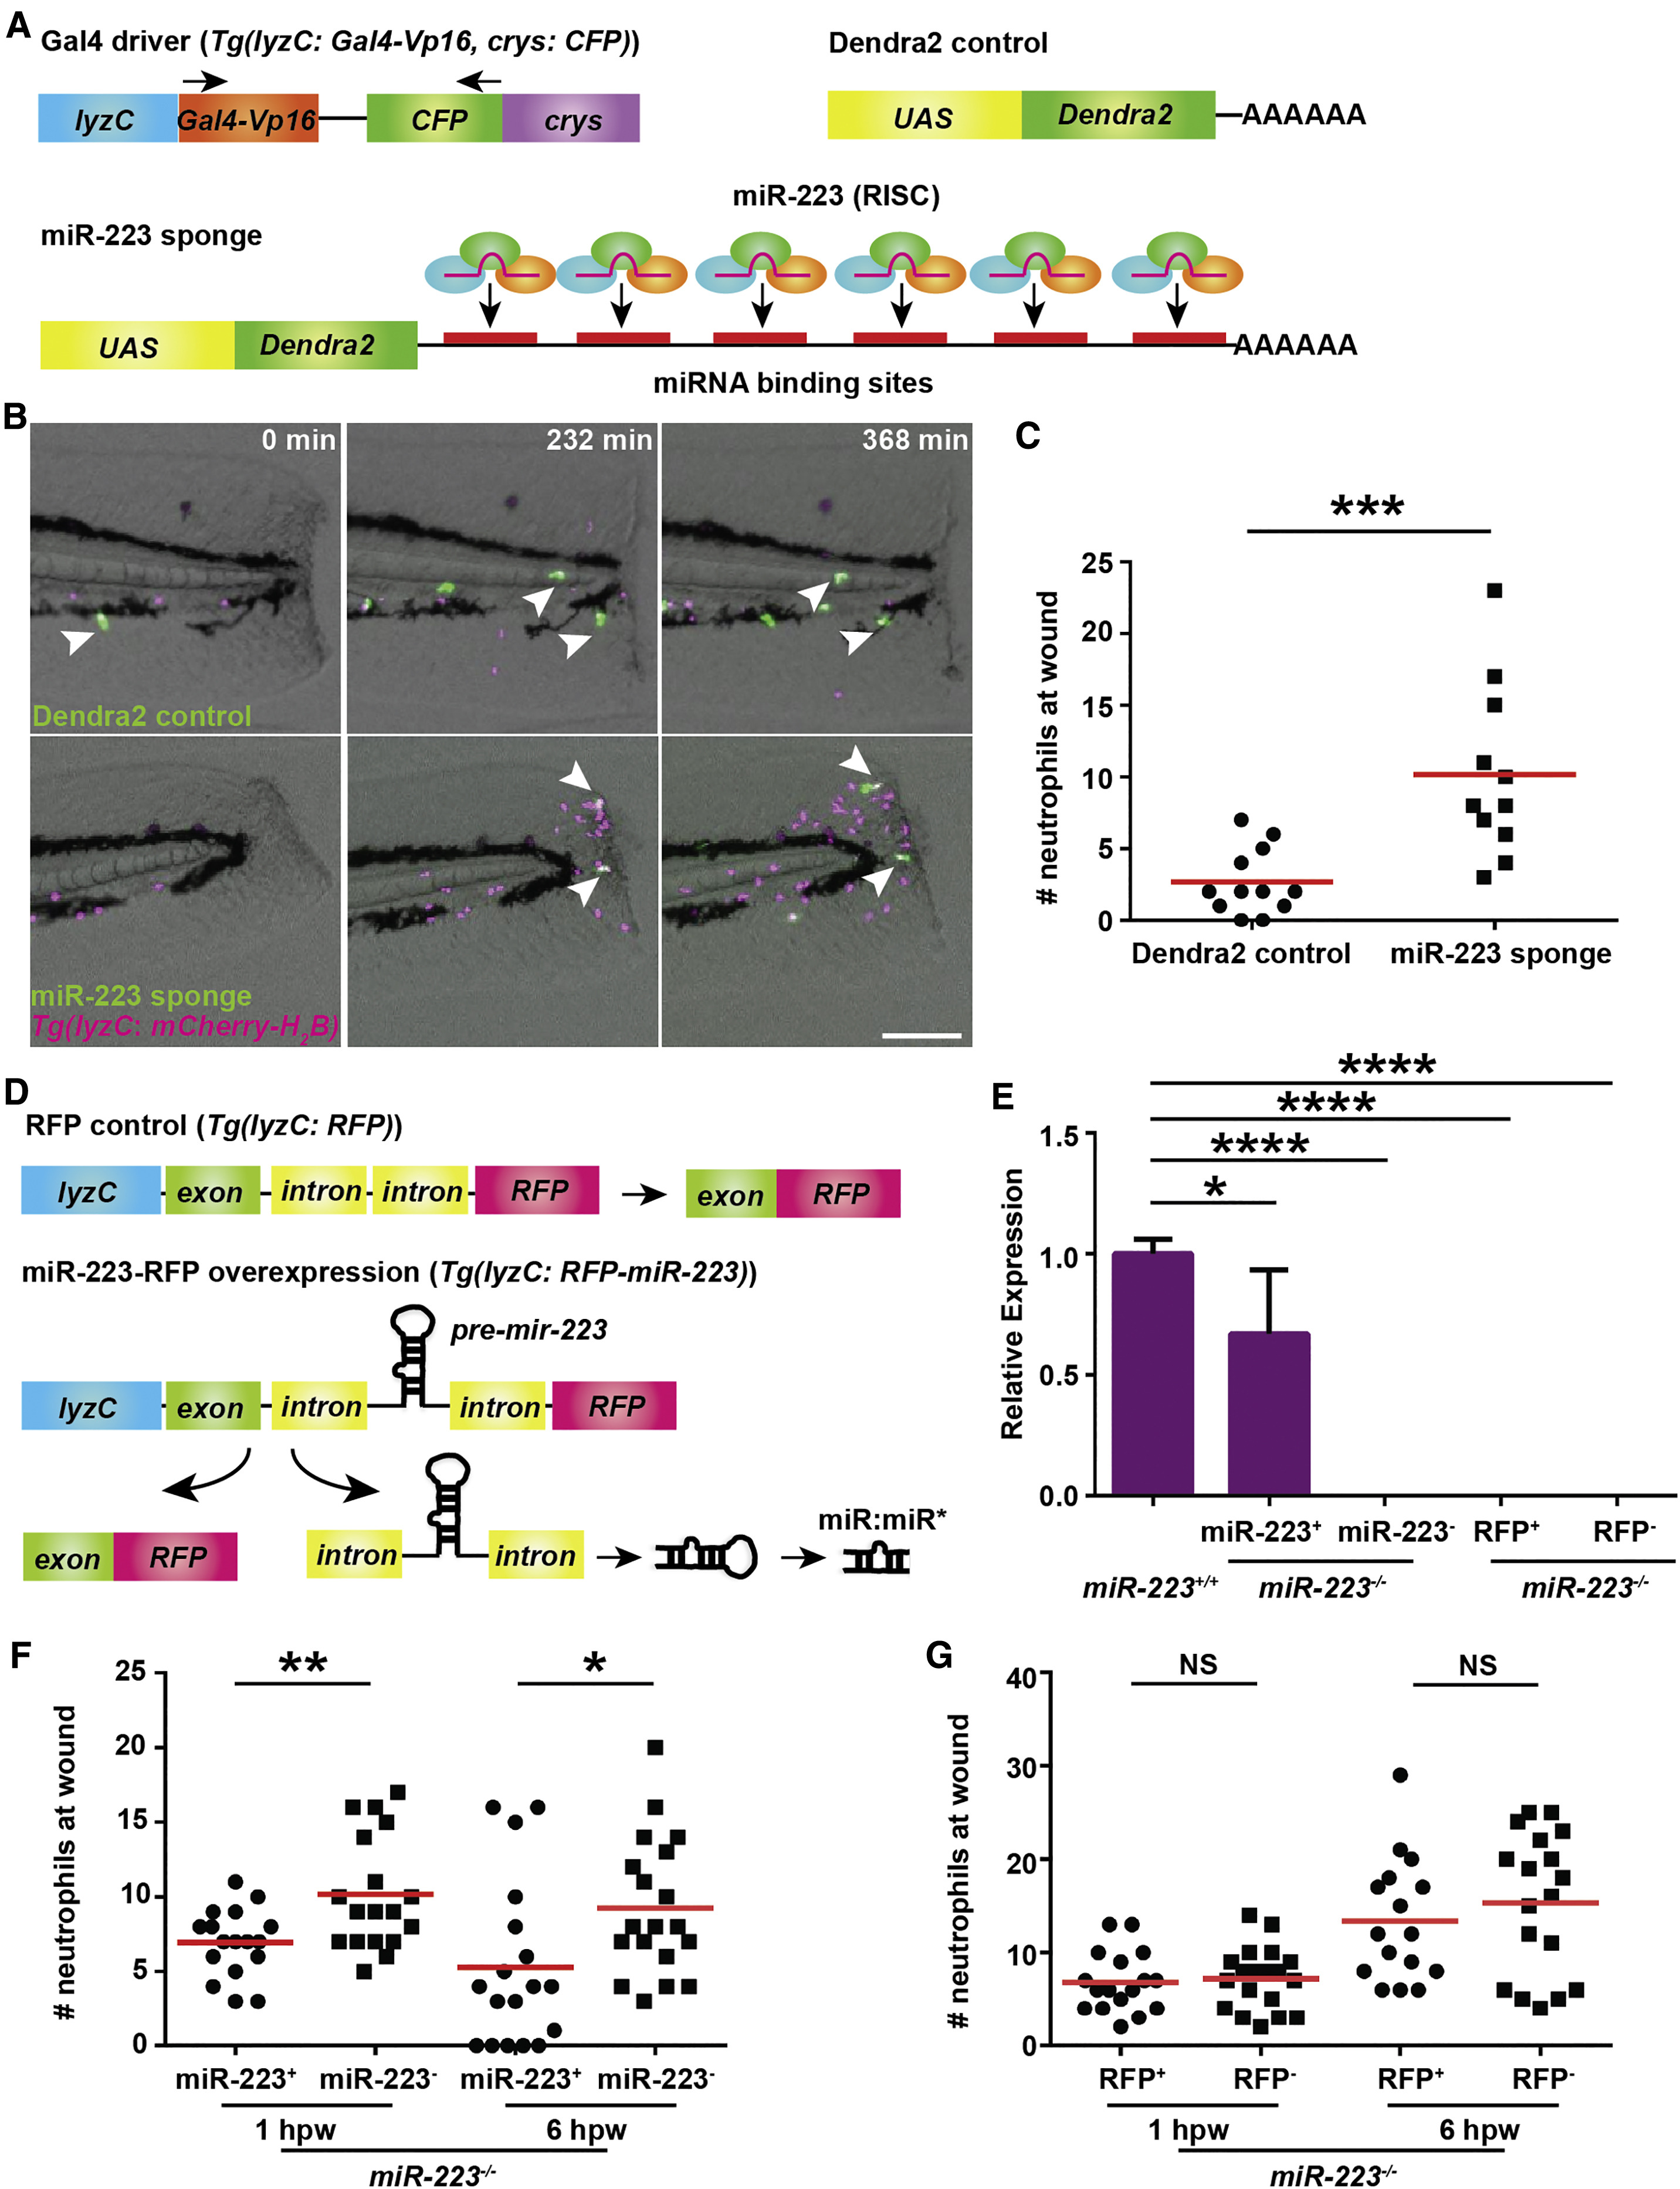
Neutrophil-Intrinsic miR-223 Regulates Neutrophilic Inflammation
(A) Schematics of Tol2-lyzC-Gal4-crys-CFP construct, injected into WT embryos to generate the transgenic line Tg(lyzC:Gal4-Vp16, crys:CFP)pu8; Tol2-UAS-miR-223 sponge that contains 6 bulged miR-223 binding sites after the UAS element and the Dendra2 control plasmid.
(B and C) miR-223 sponge or Dendra2 control plasmids in (A) were injected into embryos from Tg(lyzC: Gal4-Vp16, crys:CFP)pu8 and Tg(lyzC: mCherry-H2B) cross. Tailfins were transected at 3 dpf. Representative images at indicating time points are shown in (B), and neutrophil recruitment at 6 hpw is shown in (C).
(D) Schematics of Tol2-lyzC-miR-223/RFP constructs, injected into WT embryos to generate the transgenic line Tg(lyzC: RFP-miR-223)pu9 and the control line Tg(lyzC: RFP)pu10.
(E) The transgenic lines illustrated in (D) were crossed into the miR-223−/− background. The siblings without RFP were used as negative control. miR-223 expression in indicated groups was quantified by qRT-PCR (mean ± SD).
(F and G) Quantification of neutrophil recruitment to tail transection sites in embryos with miR-223 (F) or RFP control (G) expressed in neutrophils in the miR-223−/− background at 1 hpw and 6 hpw.
Scale bars, 100 μm. One representative experiment of three independent repeats is shown. ∗p < 0.05, ∗∗p < 0.01, ∗∗∗p < 0.001, and ∗∗∗∗p < 0.0001, unpaired Student’s t test (C, F, and G) or one-way ANOVA (E). See also Movie S1.