
|
Fig. 6
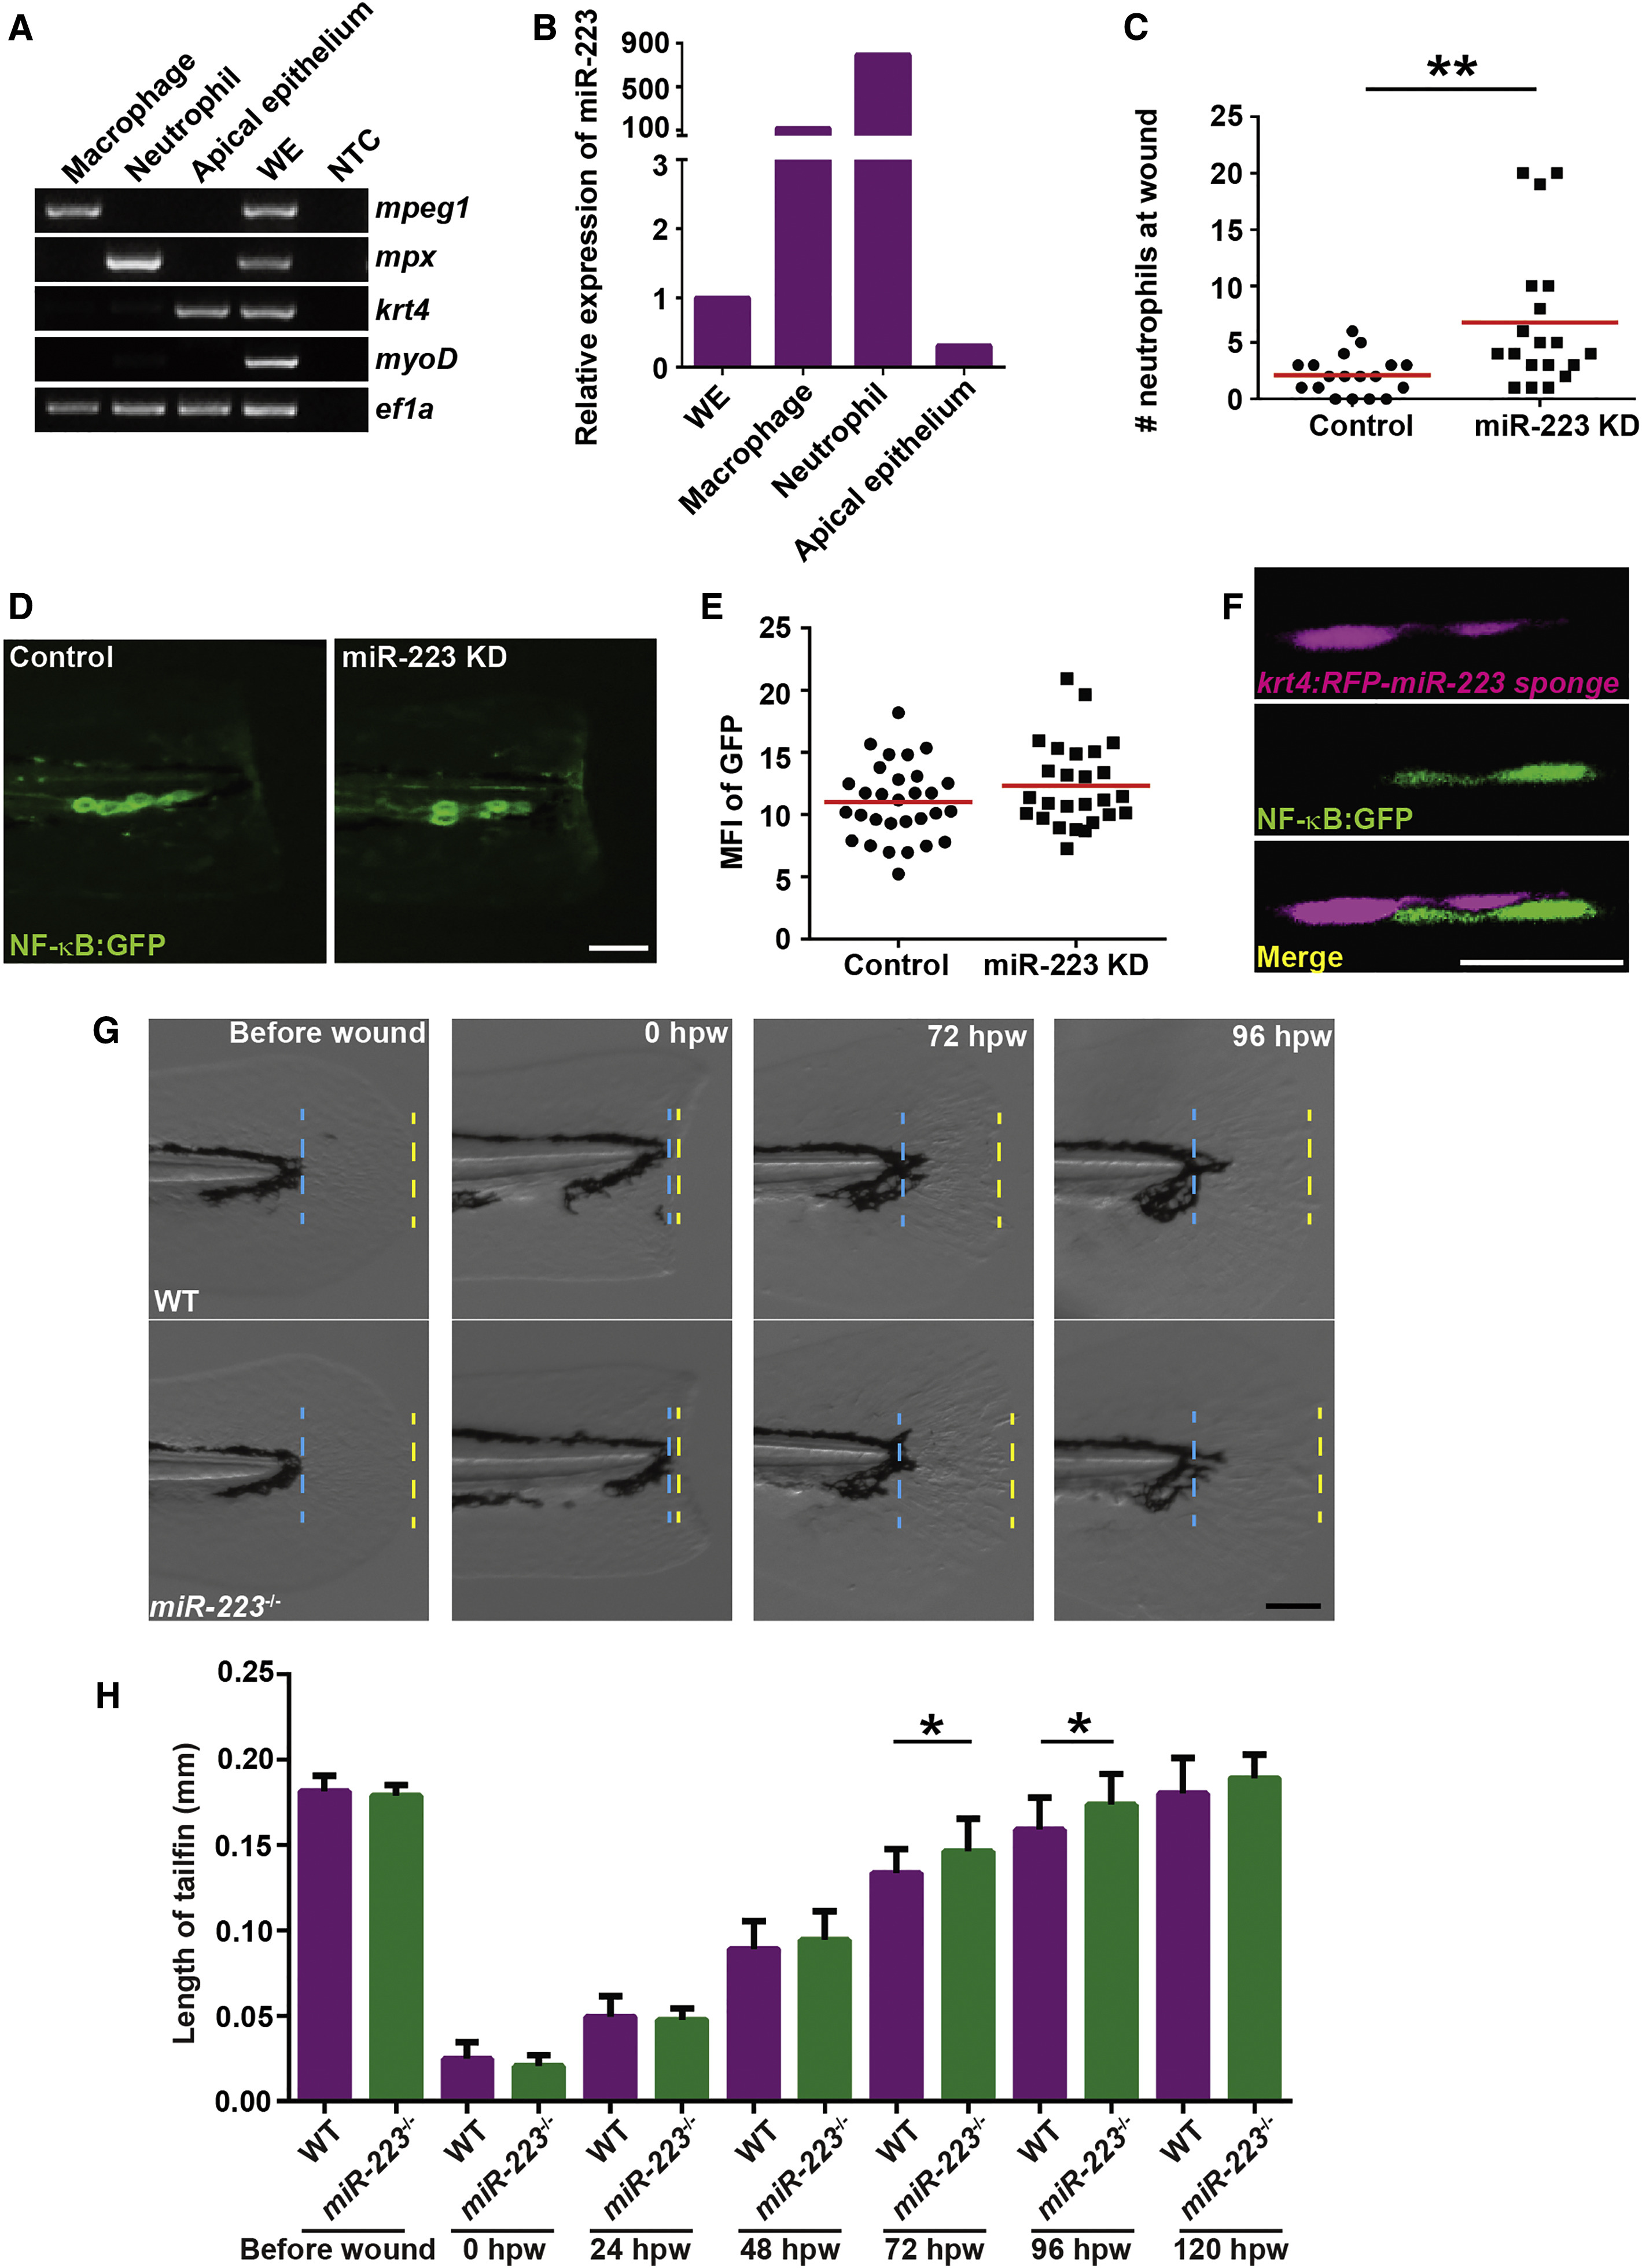
Fin Regeneration Is Accelerated in miR-223-Deficient Embryos
(A) Apical epithelial cell were sorted from the Tg(krt4:GFP)pu11 and RT-PCR of lineage-specific markers were performed as described in Figure 5A. krt4, apical epithelial cell marker.
(B) Real-time qPCR of miR-223.
(C) Quantification of neutrophil recruitment at 6 hpw in embryos from Tg(krt4: RFP-miR-223 sponge)pu12 and Tg(krt4: RFP)pu13.
(D and E) Tg(krt4: RFP-miR-223 sponge)pu12 and Tg(krt4: RFP)pu13 were crossed with Tg(NF-κB:GFP). Representative images and quantification of GFP signal at the wound edge at 6 hpw.
(F) Representative confocal images of embryos from Tg(NF-κB:GFP/krt4: RFP-miR-223 sponge)pu12 at 6 hpw.
(G and H) Tailfin regeneration in WT and miR-223−/− embryos. Tailfin transection was performed at 3 dpf. The length of regenerated tailfin was measured as the distance between the blue and yellow dash lines.
(G) Representative images of tailfins at indicated time points.
(H) Quantification of the length of tailfin at different time points (mean ± SD; n > 20 in each group).
Scale bars, 100 μm (D and G), 20 um (F). Data are representative of three independent experiments (C, E, and H) or of two independent experiments (A and B). ∗p < 0.05, ∗∗p < 0.01, and ∗∗∗∗p < 0.0001, unpaired Student’s t test.