
|
Fig. 1
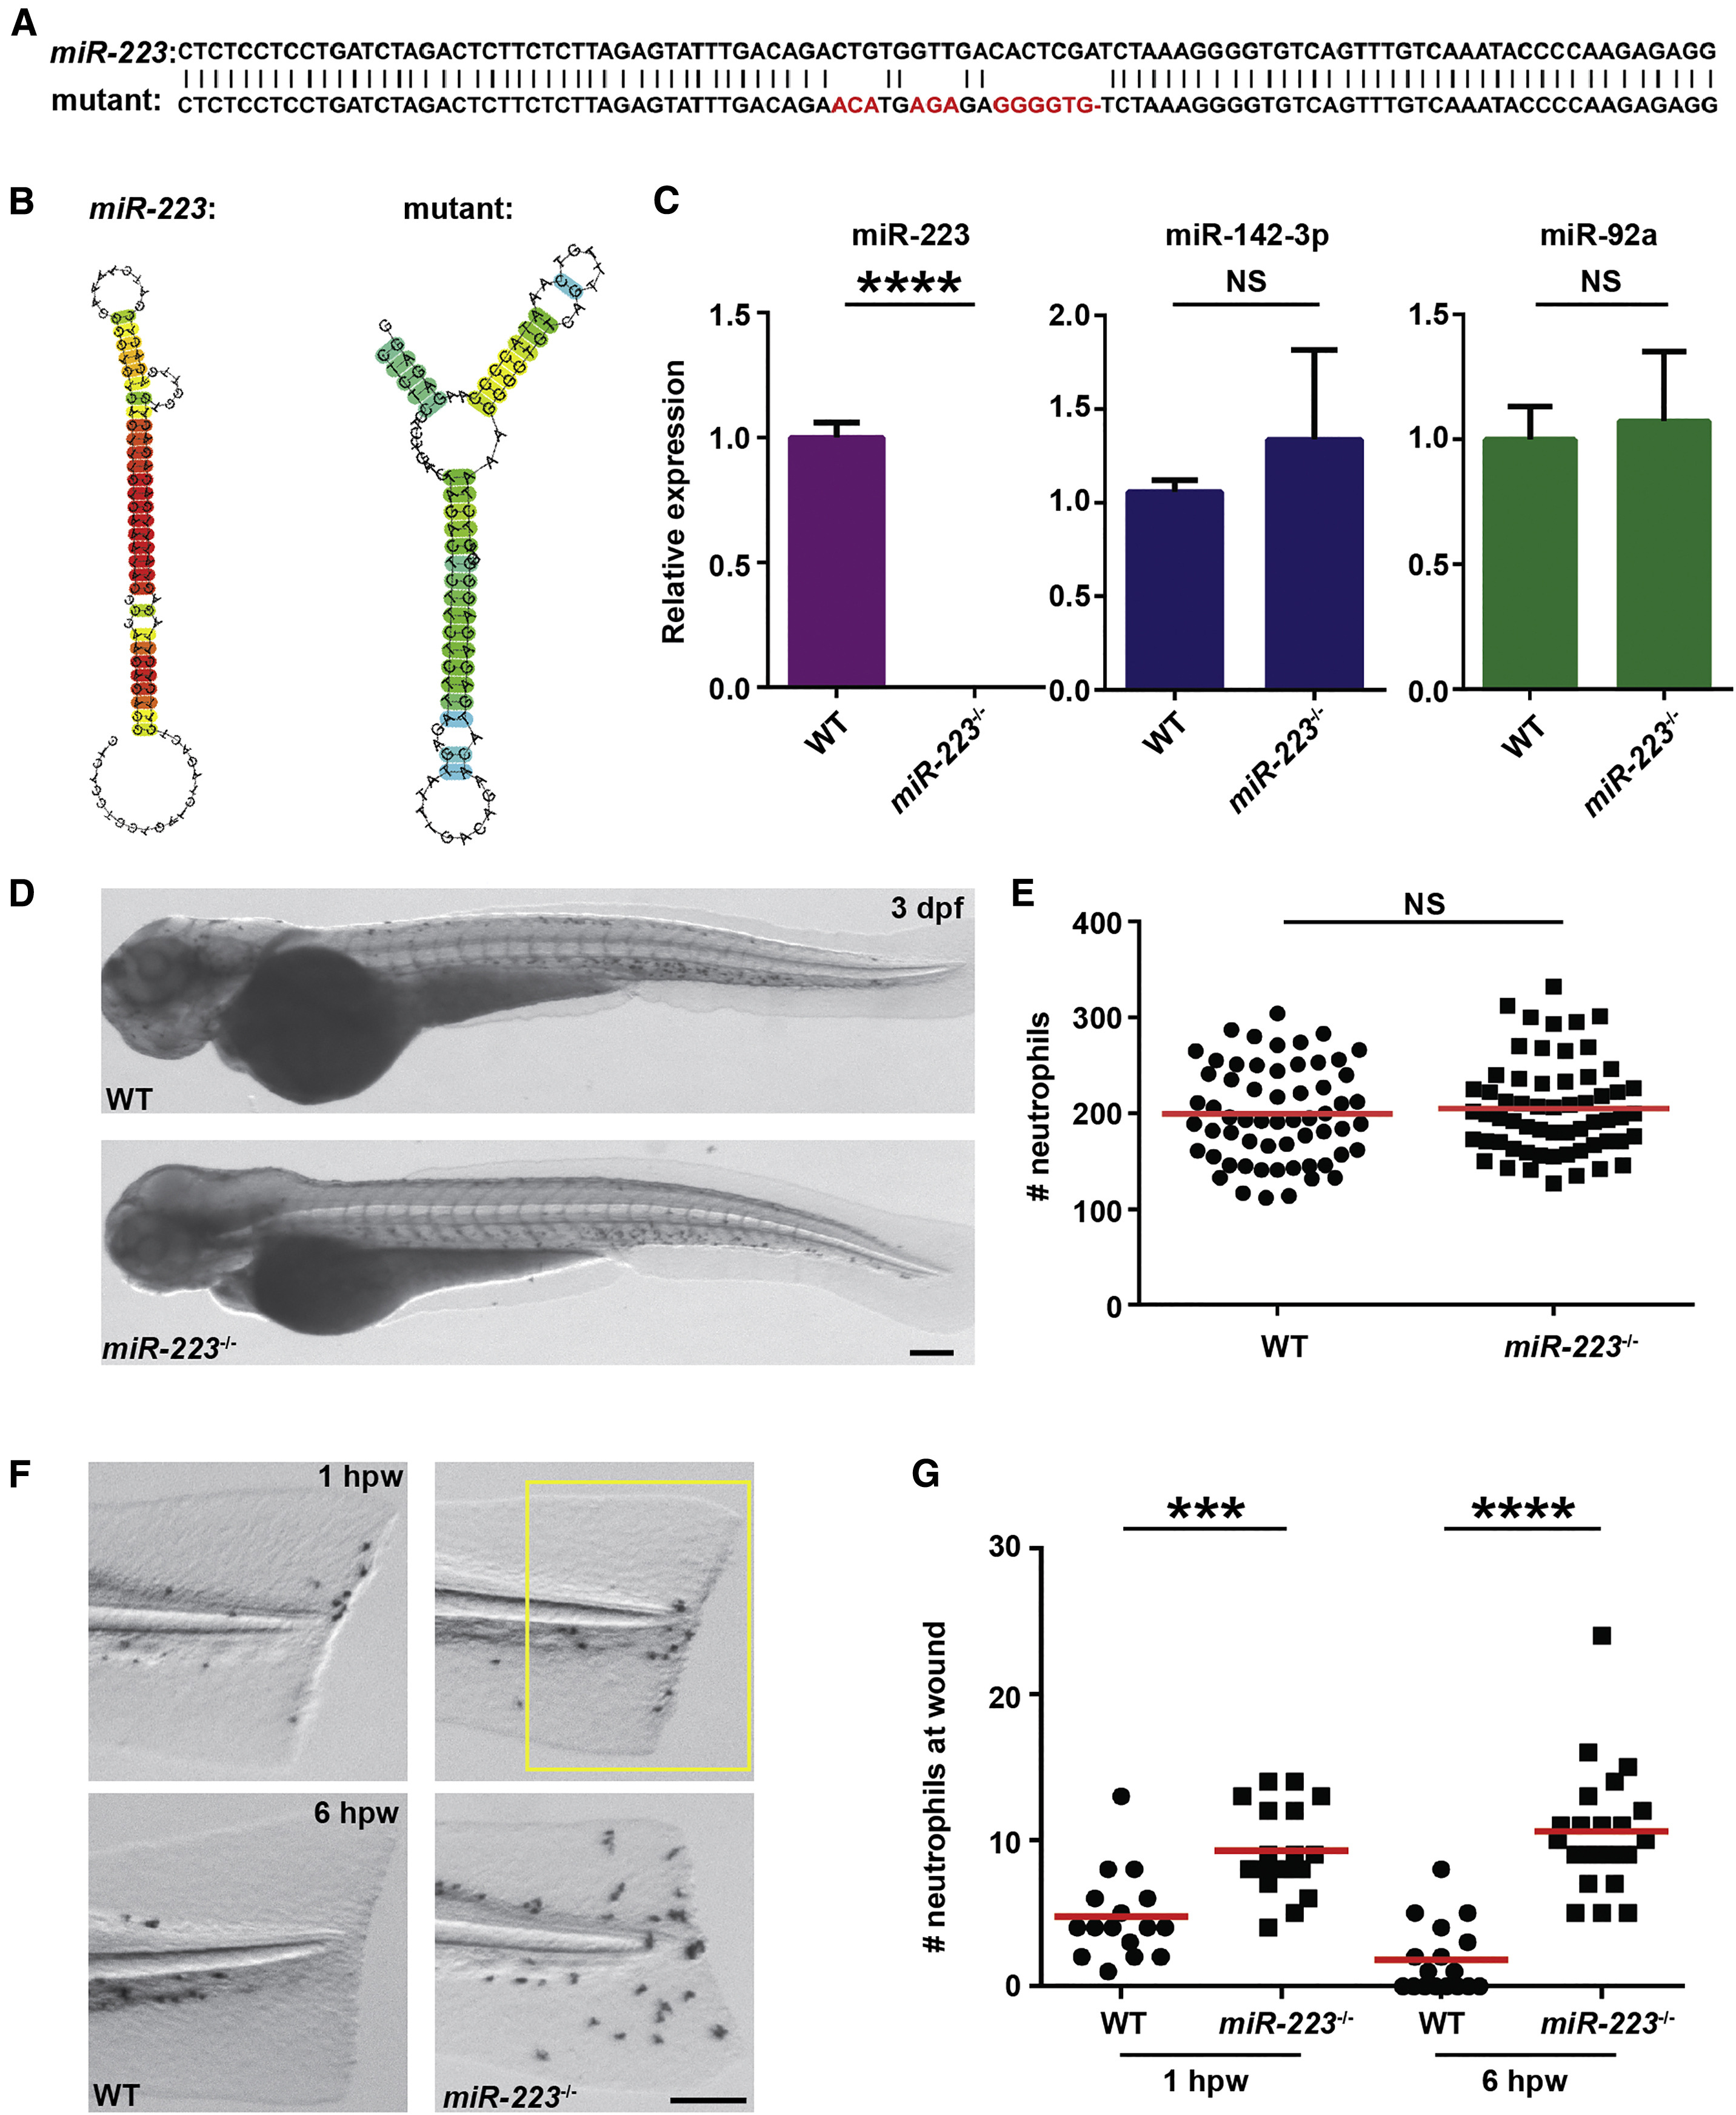
miR-223-Deficient Embryos Display Augmented Neutrophil Response to Tissue Injury
(A) Sequences of pre-mir-223 in WT and miR-223 mutant embryos. Mutated nucleotides are labeled in red.
(B) The hairpin structures of miR-223 in WT and mutant embryos predicted by Centroidfold.
(C) Expression of miR-223, miR-142-3p, and miR-92a in WT and miR-223−/− embryos determined by qRT-PCR.
(D and E) Representative images (D) and quantification (E) of total neutrophil numbers in WT and miR-223−/− embryos.
(F and G) Representative images (F) and quantification (G) of neutrophil recruitment to tail transection sites in WT and miR-223−/− embryos at 1 hpw and 6 hpw. The number of neutrophils in the boxed region were quantified. Scale bars, 100 μm.
Data are representative of three independent experiments (E and G) or are pooled from three independent experiments (C). Mean ± SD. ∗∗∗p < 0.001 and ∗∗∗∗p < 0.0001, unpaired Student’s t test. See also Figures S1 and S2.