
- Title
-
Zebrafish B Cell Development without a Pre-B Cell Stage, Revealed by CD79 Fluorescence Reporter Transgenes
- Authors
- Liu, X., Li, Y.S., Shinton, S.A., Rhodes, J., Tang, L., Feng, H., Jette, C.A., Look, A.T., Hayakawa, K., Hardy, R.R.
- Source
- Full text @ J. Immunol.
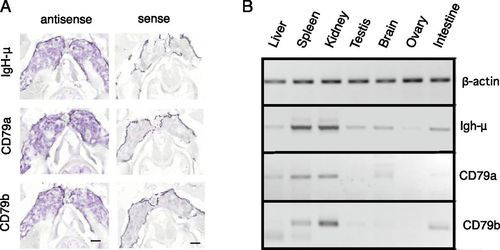
Predominant expression of CD79a and CD79b in kidney by in situ hybridization. (A) In situ hybridization of IgH-μ, CD79a, and CD79b antisense RNA probes to thin sections of zebrafish kidney. Images were processed with Nuance software to highlight hybridization signal stained by NBT/5-bromo-4-chloro-3-indolyphosphate. Right panels show background with sense probes. Scale bars, 400 μm. (B) RT-PCR analysis of CD79a and CD79b in zebrafish tissues. Image color is inverted for clarity. EXPRESSION / LABELING:
|
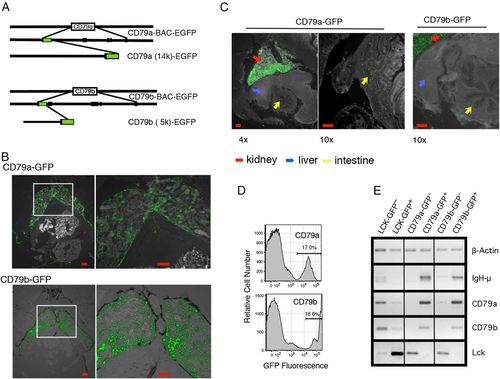
GFP expression in CD79a and CD79b transgenic zebrafish identify B cells. (A) Diagram of production of transgenic constructs, made by long PCR from BACs containing CD79a and CD79b, where the first coding exon of each was replaced by an EGFP-PolyA segment. (B) Low power (left panels) and higher power (right panels) images of GFP expression in thin sections of kidney region of adult (4–6 mo) CD79a-GFP and CD79b-GFP zebrafish. Images were processed with Nuance software to reduce background autofluorescence. Scale bars, 100 μm (left), 200 μm (right). (C) Presence of CD79a:GFP+ and CD79b:GFP+ cells outside head kidney in adult fish. CD79a-GFP, ×4 cryosection. Scale bar, 100 μm (left), and original magnification ×10 image of cryosection. Scale bar, 200 μm (right). CD79a-GFP transgenic zebrafish also showing intestinal region. Scale bar, 200 μm. (D) Flow cytometry histogram plots of kidney marrow tissue from CD79a-GFP and CD79b-GFP lines. (E) GFP− and GFP+ cell fractions were purified by electronic cell sorting from Lck-GFP, CD79a-GFP, and CD79b-GFP kidney tissue. Figure shows ethidium bromide staining of DNA amplified by RT-PCR from these samples. The lines indicate where parts of the image were joined. EXPRESSION / LABELING:
|
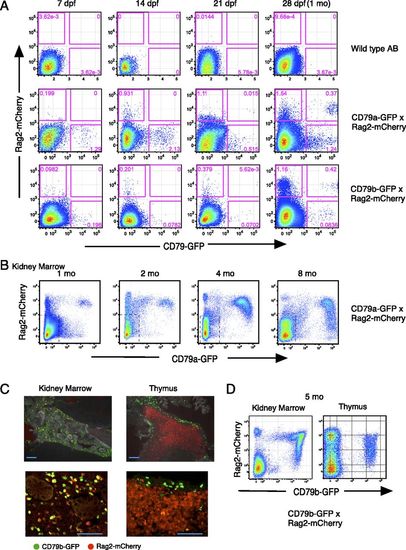
Identification of developing and mature B cells in CD79a-GFP and CD79b-GFP × Rag2-mCherry double-transgenic zebrafish. (A) B cells in young CD79a-GFP and CD79b-GFP zebrafish larvae identified by coexpression with Rag2:mCherry, analyzed by flow cytometry. Wild-type zebrafish AB line is shown as a control. Representative data of four to seven sample analyses from each day postferilization zebrafish are shown. (B) Kidney marrow of 1–8 mo CD79a-GFP × Rag2-mCherry. Dotted region is GFP−mCherry−. (C) Five month CD79b-GFP × Rag2-mCherry zebrafish. Low-power (top) and high-power (bottom) images of thin sections of kidney and thymus are shown. Scale bars, 200 μm (top) and 100 μm (bottom). (D) Flow cytometry analysis of adult CD79b-GFP × Rag2-mCherry zebrafish kidney and thymus. Dotted region is GFP−mCherry−. Frequency of CD79b:GFP+ cells in kidney is 26.4%, in thymus is 5%. Data are representative of five separate CD79b/Rag2 transgenic fish kidney analyses. EXPRESSION / LABELING:
|
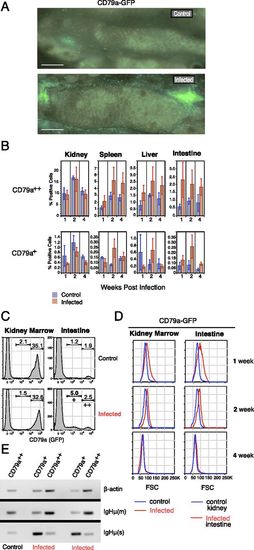
Zebrafish B cell response to bacterial infection with CD79 reduction. (A) Low-power images of intestinal region of PBS control and bacteria injected CD79a-GFP fish at 1 wk postinfection. Scale bars, 1 mm. (B) Percentage of CD79a++ and CD79a+ cells in indicated tissues at 1, 2, and 4 wk postinfection; n = 3 each, mean ± SE. (C) Flow cytometry histograms of CD79a++ and CD79a+ cells in kidney and intestine tissue 1 wk postinfection, showing the clear increase in low CD79+ cells in intestine. (D) Increase in size of CD79a+ cells from intestine of infected fish, detected by flow cytometry using forward light scatter (FSC). (E) CD79a+ cells are enriched for secreted IgM compared with CD79a++ cells. RT-PCR analysis of β-actin, membrane IgH-μ (m), and secreted IgH-μ (s). |