- Title
-
In Vivo Measurement of Glycine Receptor Turnover and Synaptic Size Reveals Differences between Functional Classes of Motoneurons in Zebrafish
- Authors
- Chow, D.M., Zuchowski, K.A., Fetcho, J.R.
- Source
- Full text @ Curr. Biol.
|
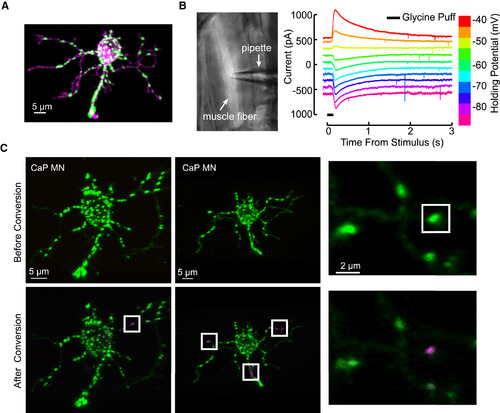
The Expression of dendra2-GlyRα1 in Motoneurons, Physiology of dendra2-GlyRα1 Channels in Muscle Fibers, and Synapse Level Targeting for dendra2 Photoconversion (A) A single motoneuron expressing dendra2-GlyRα1 (green) along with membrane targeted tdTomato (magenta), exhibiting distributed glycinergic puncta along the labeled soma and dendrites. See also Figure S1 for costaining with gephyrin. (B) Expression of dendra2-GlyRα1 in muscle to test channel formation. Left: transgenic muscle fiber targeted for patch recording. Right: voltage-clamp recordings at the indicated holding potentials in a muscle fiber. (C) Precise targeting with a 405-nm laser allowed us to convert synaptically localized dendra2-GlyRα1 from green (top) to red fluorescence (bottom, represented as magenta) with near single-synapse accuracy. |
|
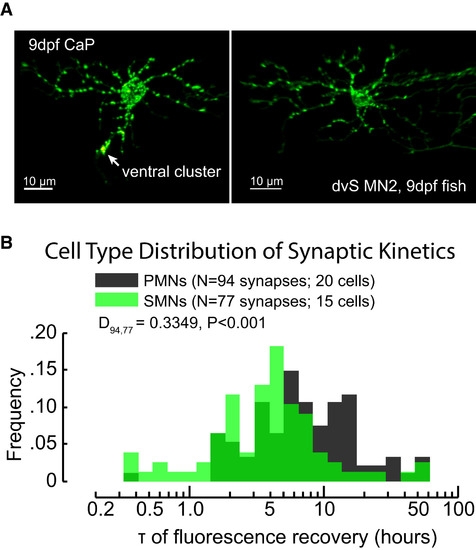
The Distribution of GlyR Turnover Kinetics Measured from Primary and SMNs (A) Images of a 9-dpf dendra2-GlyR α1-labeled PMN (left) and SMN (right) prior to photoconversion experiments. PMNs have larger somas than SMNs and have large specialized glycinergic synapses on the ventral dendrite/axon hillock region (see ventral cluster arrow). (B) The overlaid histograms of estimated τ (on log axis) from photoconversion experiments on 94 PMN synapses (gray) and 77 SMN synapses (green). PMN synapses were more likely to have long recovery times (larger values of ln τ) than SMN synapses (two-sample KS test, p < 0.001). See also Figure S3. |
|
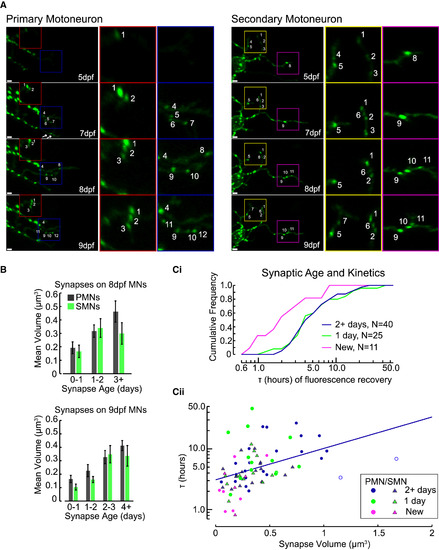
Synaptic Age and Kinetics (A) Example PMN (left) and SMN (right) imaged at 5, 7, 8, and 9 dpf were examined for the formation of new synapses. Individual synapses are numbered to show examples of tracking over time. Note the appearance of new synapses 9 and 10 at 8 dpf on the PMN (left, blue inset) due to the growth of a new branch from a more ventral process and the loss of the branch containing synapses 5, 6, and 7 previously. White bars in bottom left of panels are 2 μm. (B) Synaptic volumes on 8-dpf (top) and 9-dpf (bottom) motoneurons organized by the timing of formation for each synapse (n = 8 PMNs and 7 SMNs total, see text for statistics; see also Figure S6). Error bars represent SEM. (Ci and Cii) Cumulative frequency histograms for τ of new, 1-day-old, and 2+-day-old synapses (Ci) and the τ (on log axis) of photoconverted synapses plotted against their volume (Cii). The blue line represents the fit of a LME model to 2+-dpf synapses. See also Figure S7. |
|
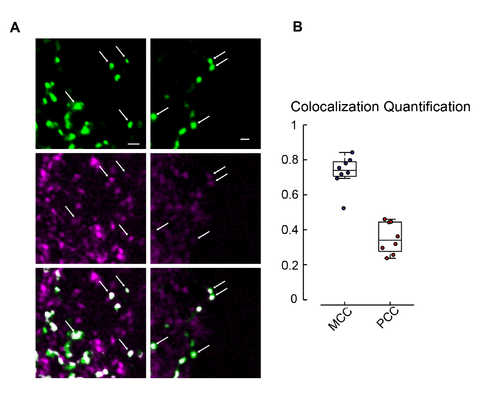
Co-localization of eGFP-GlyR1 and gephyrin. Related to Figure 1. (A) Sections of spinal cord in zebrafish larvae stochastically expressing eGFP-GlyRα1 in motoneurons co-stained with anti-GFP (top) and anti- Gephryin (middle) show co-localization of GFP positive puncta with gephyrin positive regions (bottom). (B) Quantification of the co-localization data. Mander’s Co-localization Coefficient (MCC), which quantifies the percentage of green fluorescence that has an above-threshold signal for gephyrin fluorescence, has a mean of 0.73. Pearson’s Correlation Coefficient (PCC) quantifies the correlation between the intensity of fluorescence in the gephyrin and GFP channels for synaptic ROIs and had a mean of 0.35. All cells had significant correlation of mean fluorescence intensity in synaptic ROIs between anti-GFP and anti-gephyrin staining. |
|
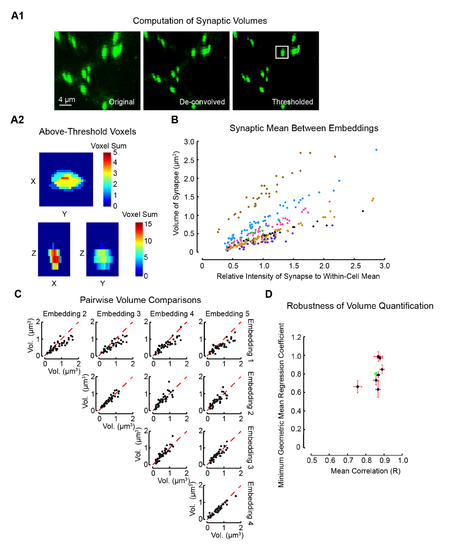
Methodology and Validation for Estimation of Synaptic Volumes from 2P Imaging Using Deconvolution and Thresholding. Related to Figure 5. (A1) Stages of image processing during synaptic volume estimation. Raw multiphoton fluorescence images (original) were de-convolved using an empirically derived point spread function (de-convolved) and then thresholded at 6 standard deviations above the mean dendritic fluorescence (thresholded). Rectangular cuboids of 1.5x1.5x4 μm3 in volume around each synapse were used to estimate their volumes. (A2) The summed projection of above-threshold voxels of the boxed synapse in A1 (see heat map) for each pair of dimensions. (B) The relative intensity and average estimated volume for each synapse of 7 motoneurons (color coded by cell) averaged across several re-embeddings of the larvae. (C) Pairwise comparisons of the estimated volume for each synapse for each embedding combination across 5 larval embeddings and imaging of the same motoneuron. (D) Quantification of the mean correlation between all possible pairwise combinations embeddings for each motoneuron (horizontal axis) and model II regression slope coefficient (vertical axis) for each of the 7 motoneurons. Error bars in each dimension represent standard error of the mean. The green X represents the grand mean of all motoneurons in this plot. |

