
|
Fig. 7
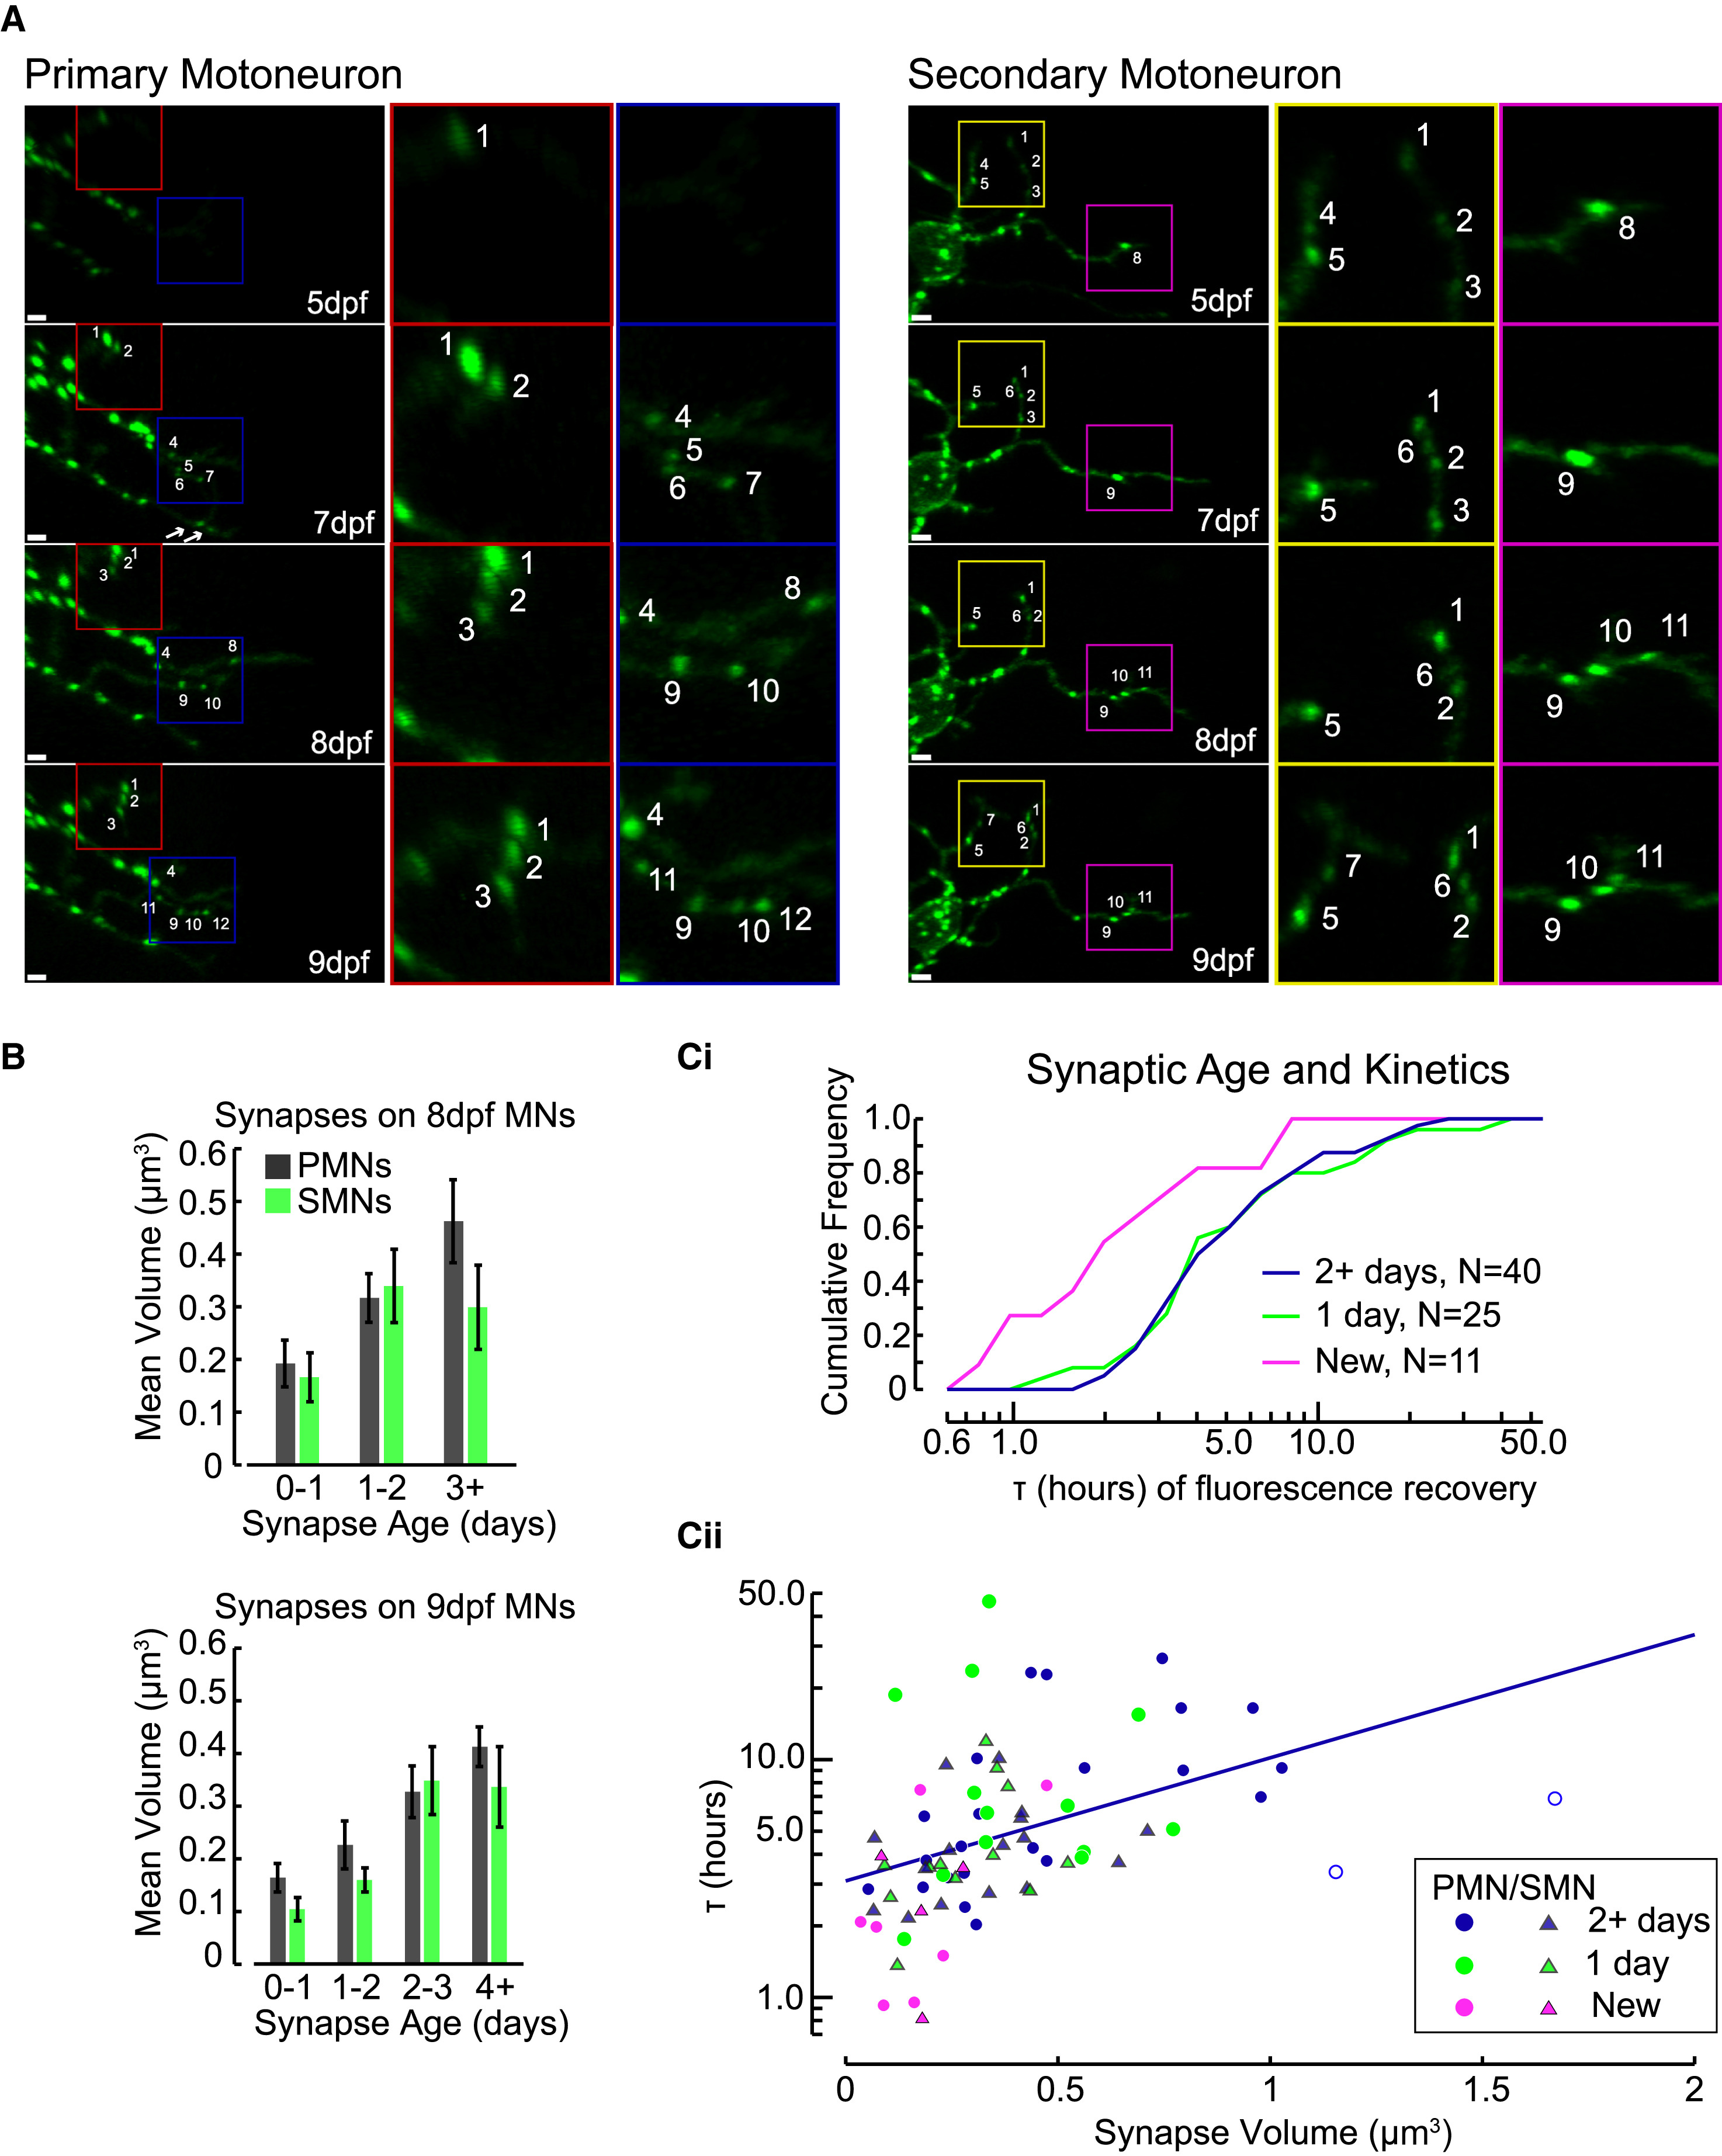
Synaptic Age and Kinetics
(A) Example PMN (left) and SMN (right) imaged at 5, 7, 8, and 9 dpf were examined for the formation of new synapses. Individual synapses are numbered to show examples of tracking over time. Note the appearance of new synapses 9 and 10 at 8 dpf on the PMN (left, blue inset) due to the growth of a new branch from a more ventral process and the loss of the branch containing synapses 5, 6, and 7 previously. White bars in bottom left of panels are 2 μm.
(B) Synaptic volumes on 8-dpf (top) and 9-dpf (bottom) motoneurons organized by the timing of formation for each synapse (n = 8 PMNs and 7 SMNs total, see text for statistics; see also Figure S6). Error bars represent SEM.
(Ci and Cii) Cumulative frequency histograms for τ of new, 1-day-old, and 2+-day-old synapses (Ci) and the τ (on log axis) of photoconverted synapses plotted against their volume (Cii). The blue line represents the fit of a LME model to 2+-dpf synapses.
See also Figure S7.