
|
Fig. S4
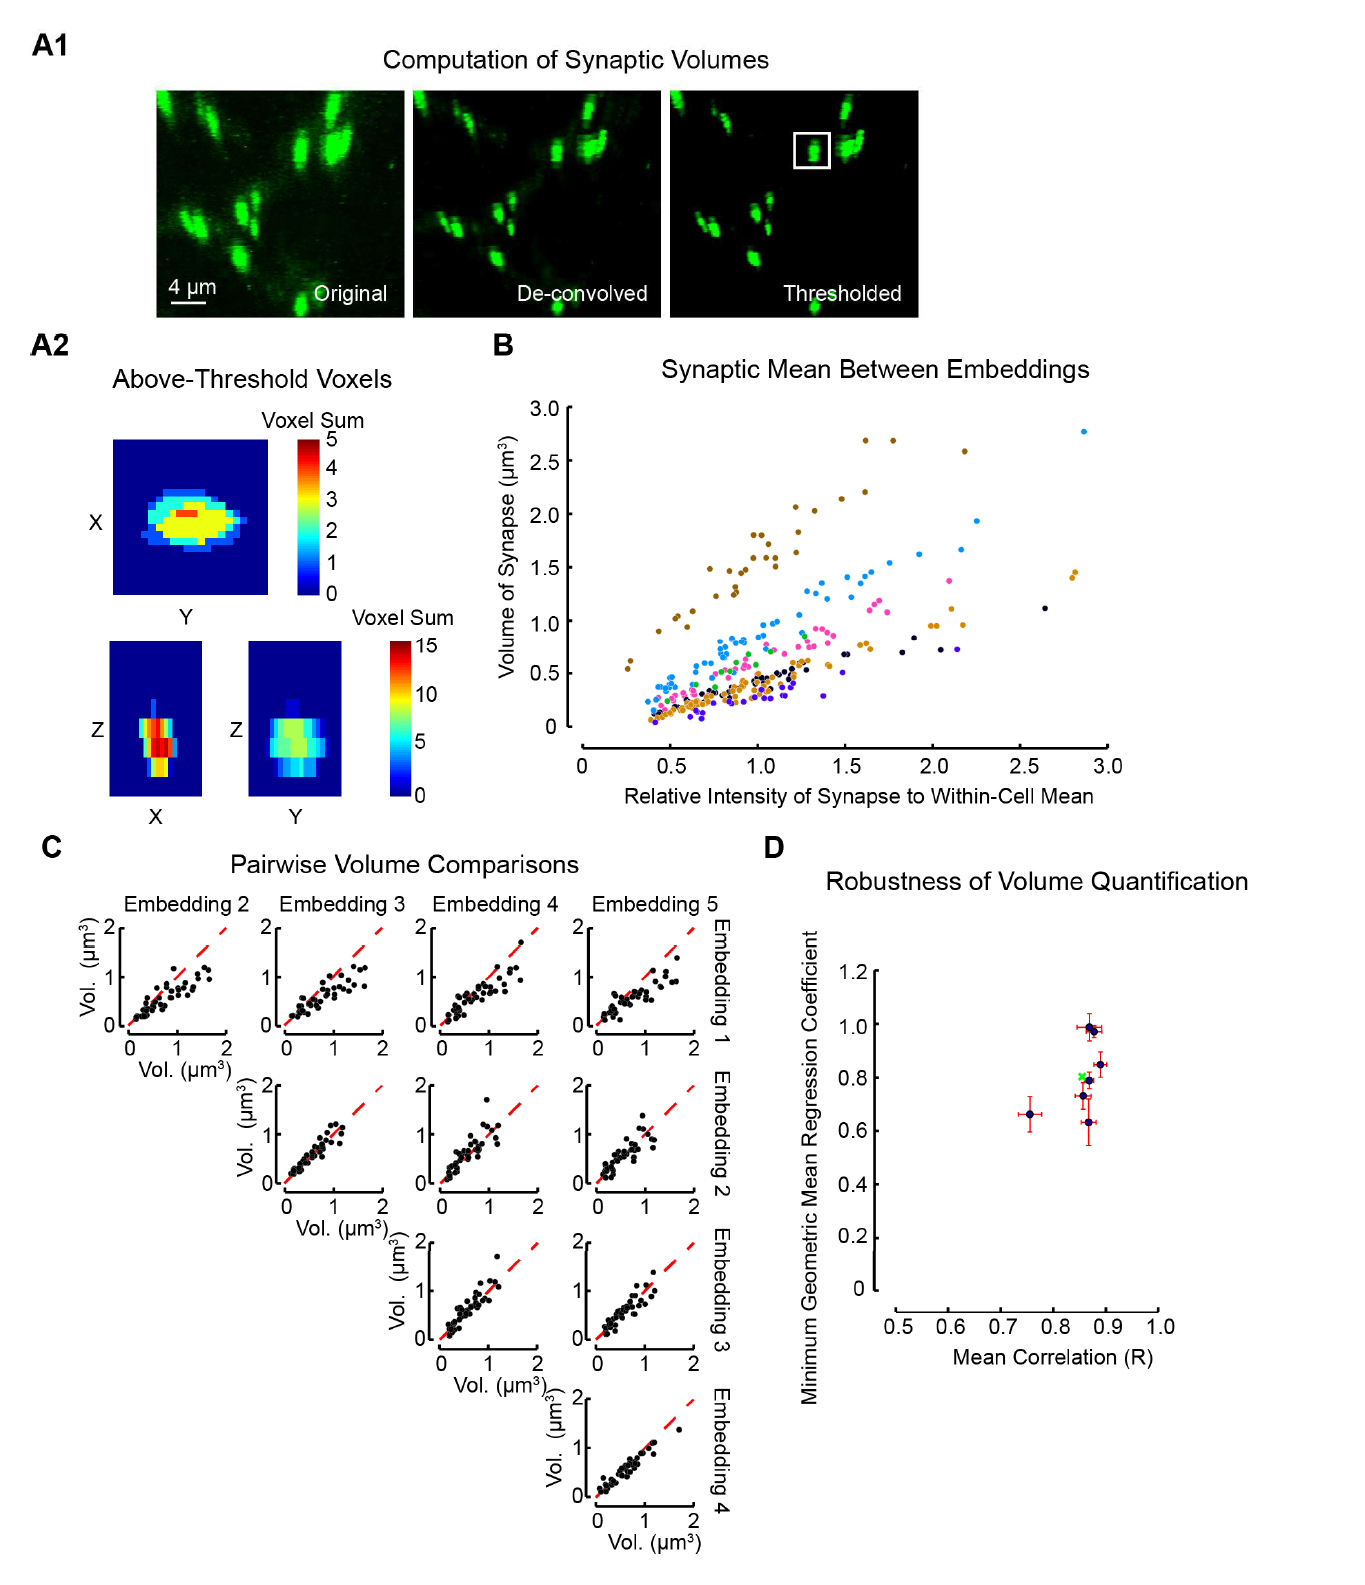
Methodology and Validation for Estimation of Synaptic Volumes from 2P Imaging Using Deconvolution and Thresholding. Related to Figure 5.
(A1) Stages of image processing during synaptic volume estimation. Raw multiphoton fluorescence images (original) were de-convolved using an empirically derived point spread function (de-convolved) and then thresholded at 6 standard deviations above the mean dendritic fluorescence (thresholded). Rectangular cuboids of 1.5x1.5x4 μm3 in volume around each synapse were used to estimate their volumes.
(A2) The summed projection of above-threshold voxels of the boxed synapse in A1 (see heat map) for each pair of dimensions.
(B) The relative intensity and average estimated volume for each synapse of 7 motoneurons (color coded by cell) averaged across several re-embeddings of the larvae.
(C) Pairwise comparisons of the estimated volume for each synapse for each embedding combination across 5 larval embeddings and imaging of the same motoneuron.
(D) Quantification of the mean correlation between all possible pairwise combinations embeddings for each motoneuron (horizontal axis) and model II regression slope coefficient (vertical axis) for each of the 7 motoneurons. Error bars in each dimension represent standard error of the mean. The green X represents the grand mean of all motoneurons in this plot.