
|
Fig. S1
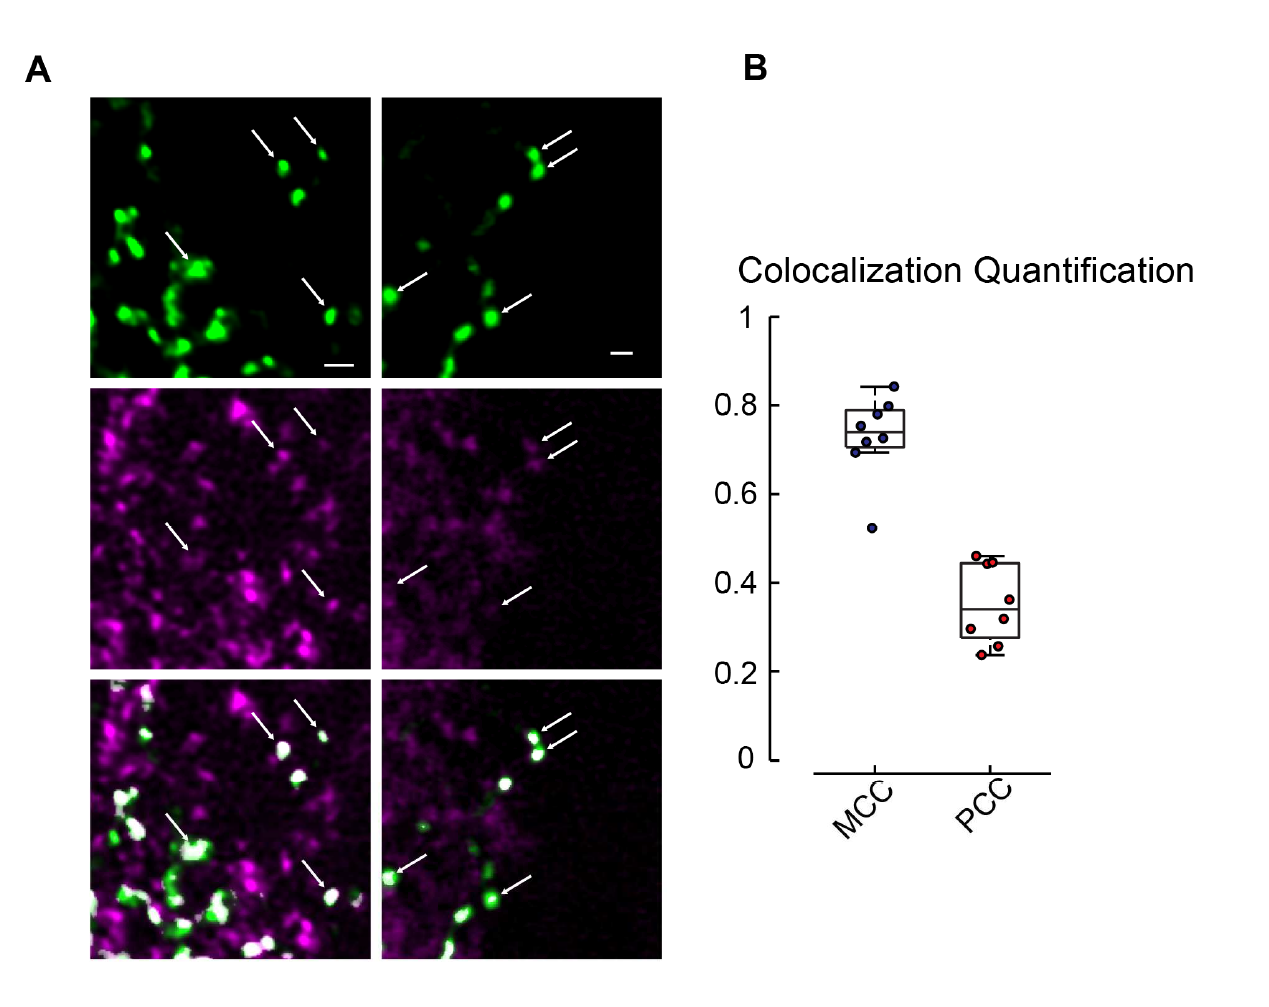
Co-localization of eGFP-GlyR1 and gephyrin. Related to Figure 1.
(A) Sections of spinal cord in zebrafish larvae stochastically expressing eGFP-GlyRα1 in motoneurons co-stained with anti-GFP (top) and anti- Gephryin (middle) show co-localization of GFP positive puncta with gephyrin positive regions (bottom).
(B) Quantification of the co-localization data. Mander’s Co-localization Coefficient (MCC), which quantifies the percentage of green fluorescence that has an above-threshold signal for gephyrin fluorescence, has a mean of 0.73. Pearson’s Correlation Coefficient (PCC) quantifies the correlation between the intensity of fluorescence in the gephyrin and GFP channels for synaptic ROIs and had a mean of 0.35. All cells had significant correlation of mean fluorescence intensity in synaptic ROIs between anti-GFP and anti-gephyrin staining.