
|
Fig. 4
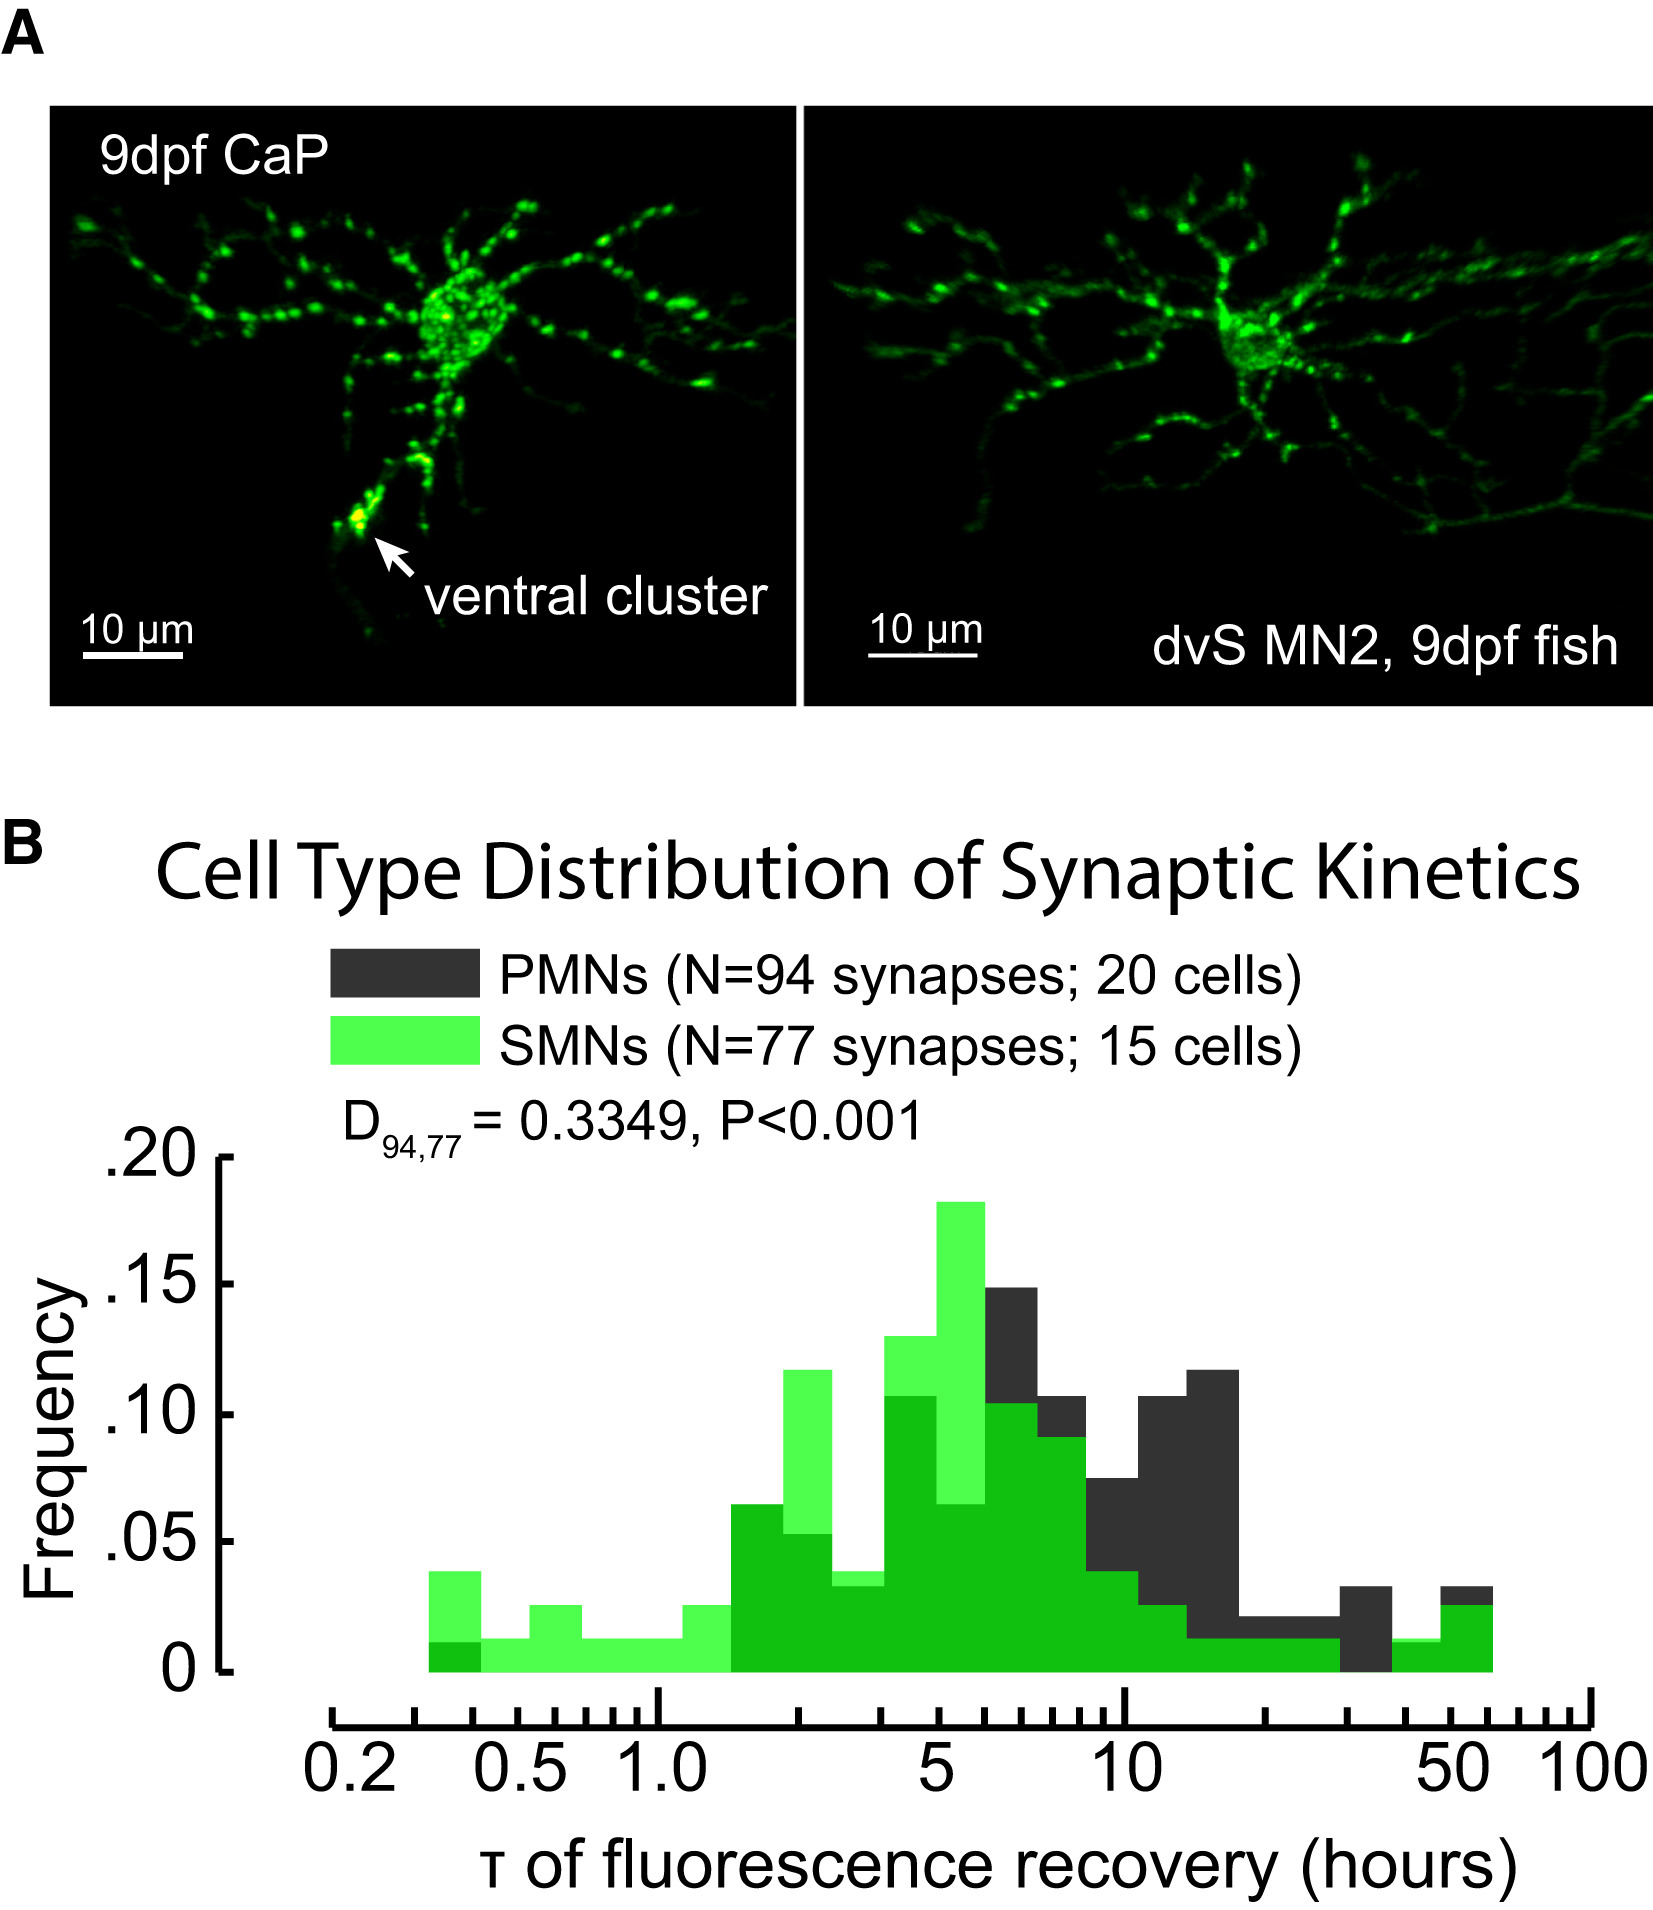
The Distribution of GlyR Turnover Kinetics Measured from Primary and SMNs
(A) Images of a 9-dpf dendra2-GlyR α1-labeled PMN (left) and SMN (right) prior to photoconversion experiments. PMNs have larger somas than SMNs and have large specialized glycinergic synapses on the ventral dendrite/axon hillock region (see ventral cluster arrow).
(B) The overlaid histograms of estimated τ (on log axis) from photoconversion experiments on 94 PMN synapses (gray) and 77 SMN synapses (green). PMN synapses were more likely to have long recovery times (larger values of ln τ) than SMN synapses (two-sample KS test, p < 0.001).
See also Figure S3.