- Title
-
Identification of the optic recess region as a morphogenetic entity in the zebrafish forebrain
- Authors
- Affaticati, P., Yamamoto, K., Rizzi, B., Bureau, C., Peyriéras, N., Pasqualini, C., Demarque, M., Vernier, P.
- Source
- Full text @ Sci. Rep.
|
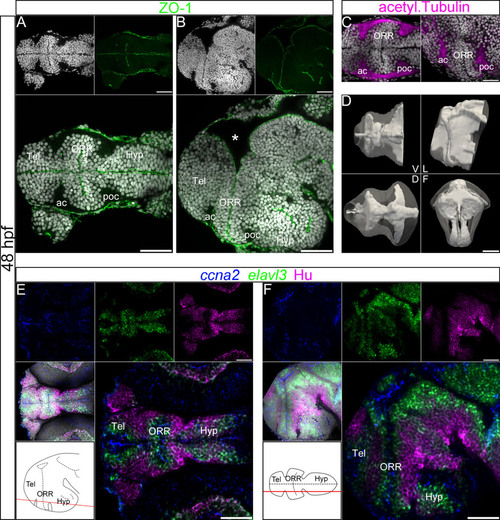
Ventricular organization and the centrifugal gradient of neurogenesis at 48 hpf. (A–C): Single confocal plane of a 48hpf embryonic forebrain stained with DAPI (gray), immunolabeled for ZO-1 (A and B) or acetylated α-tubulin (C), in ventral (A and left panel in C) and lateral (B and right panel in C) views. The telencephalon (Tel), the optic recess region (ORR), and the hypothalamus (Hyp) form three distinct cellular regions in the secondary prosencephalon. The ORR is bordered by the dense fiber bundles, the anterior commissure (ac) and post-optic commissure (poc). The asterisk (*) in (B) (lateral view) indicates the enlargement of the dorsal ventricular lumen corresponding to the anterior intraencephalic sulcus (AIS). (D): Surface rendering of the shape of ventricle (white, in opacity), reconstructed from ZO-1 immunolabeling, overlapped on the shape of the brain (white, in transparency), reconstructed from DAPI staining. V = ventral, D = dorsal, L = lateral and F = frontal views. The 3D representation of both ventricle and brain facilitates the visualization of the convoluted ventricular organization in the forebrain. (E–F): Single confocal plane of a 48hpf embryonic forebrain labeled for the neurogenic markers ccna2, elavl3 and HuC/D in ventral (E) and lateral (F) views. Bottom left drawings show the level of corresponding optical planes. ccna2-positive proliferative cells are concentrated around the ventricular zones, while elavl3-positive differentiating and HuC/D-positive differentiated cells are located at the periphery of the neural tube. Scale bars = 50µm. |
|
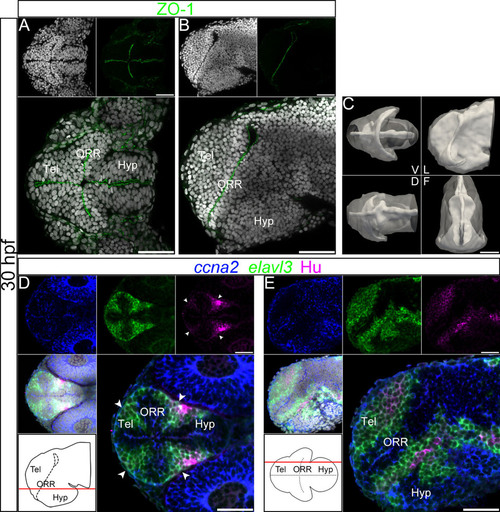
Ventricular organization and the centrifugal gradient of neurogenesis at 30hpf. (A–B): Single confocal plane of a 30hpf embryonic forebrain stained with DAPI (gray) and immunolabeled for ZO-1, in ventral (A) and lateral (B) views. (C): Surface rendering of the shape of ventricle (white, in opacity), reconstructed from ZO-1 immunolabeling, overlapped on the shape of the brain (white, in transparency), reconstructed from DAPI staining. V = ventral, D = dorsal, L = lateral and F = frontal views. At 30hpf the organization of the ventricular system is less complex than at 48hpf. The frontal view displays a characteristic keyhole shape of the ventricle, with a larger lateral expansion of the ventral part compared to the dorsal part. (D–E): Single confocal plane of a 30hpf embryonic forebrain labeled with the neurogenic markers ccna2, elavl3 and HuC/D, in ventral (D) and lateral (E) views. Bottom left drawings show the level of the corresponding optical plane. The ccna2 staining is located around the ventricular walls but in wider territories than at 48hpf. The elavl3 staining is detected adjacent to the ccna2 staining, also in wider territories than at 48hpf. Accordingly, much fewer HuC/D-positive cells are detected than at 48hpf, and they are all distributed at the periphery of the neural tube. The arrowheads in D indicate Hu-expressing cells located at the boundaries of telencephalon/ORR and ORR/hypothalamus. Scale bars = 50µm. |
|
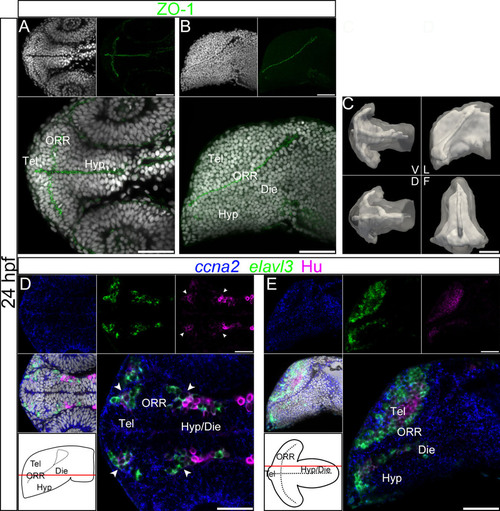
Ventricular organization and the centrifugal gradient of neurogenesis at 24hpf. (A–B): Single confocal plane of a 24hpf embryonic forebrain stained with DAPI (gray) and immunolabeled for ZO-1, in ventral (A) and lateral (B) views. diencephalon (Die); hypothalamus (Hyp); optic recess region (ORR); telencephalon (Tel). (C): Surface rendering of the shape of ventricle (white, in opacity), reconstructed from ZO-1 immunolabeling, overlapped on the shape of the brain (white, in transparency), reconstructed from DAPI staining. V = ventral, D = dorsal, L = lateral and F = frontal views. At 24hpf the organization of the ventricular system is considerably simpler than at 48hpf. The telencephalic ventricle rostral to the optic recess is not yet expanded (in contrast to 30hpf). (D–E): Single confocal plane of a 24hpf embryonic forebrain labeled for the neurogenic markers ccna2, elavl3 and HuC/D, in ventral (D) and lateral (E) views. Bottom left drawings show the level of corresponding optical plane. The ccna2 staining is widely distributed while elavl3 and especially HuC/D expressions are restricted to small peripheral territories. The arrow heads in D indicate Hu-expressing cells located at the boundaries of telencephalon/ORR and ORR/hypothalamus. Scale bars = 50µm. |
|
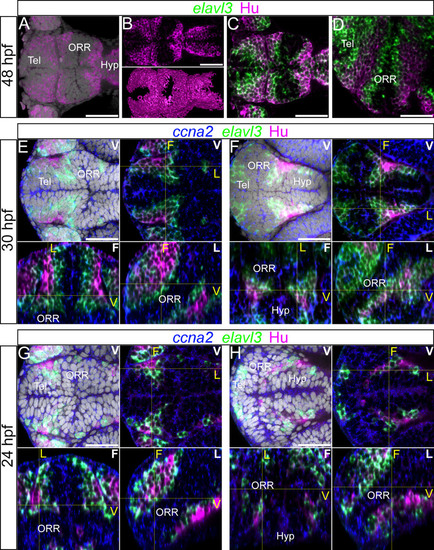
Differentiated cells mark the boundaries of each morphogenetic entity of the secondary prosencephalon. (A–D): 48hpf forebrain labeled for elavl3 and HuC/D superimposed on DAPI staining (gray). (A–B): HuC/D labeling with DAPI (A) and without DAPI (B). The top panel of B shows a single confocal plane of a ventral view and bottom panel of B shows the surface rendering of segmented HuC/D immunolabeling alone. These images show that the HuC/D staining itself is able to recapitulate the outline of the three morphogenetic entities. (C–D): Single confocal plane of a ventral (C) and lateral (D) view of elavl3 and Hu labeling. Two rows of HuC/D-positive cells are in apposition at boundaries: the boundary between the telencephalon (Tel) and the optic recess region (ORR), and the boundary between ORR and the hypothalamus (Hyp). (E–H): Single confocal plane of the forebrain labeled with the neurogenic markers ccna2, elavl3 and HuC/D at 30hpf (E–F) or 24hpf (G–H) in different views. In each case, the ventral view (indicated “V” in white) is shown on the top (with DAPI on the left, without DAPI on the right). The bottom images show the frontal (indicated “F” in white) and lateral (indicated “L” in white) views reconstructed using Z-projections of the ventral images. As they are ventral, frontal and lateral views from a single embryo, corresponding section levels of different views are indicated in yellow lines and yellow letters. As shown at 48hpf (A–D), two layers of HuC/D labeling are detected around the boundary of the three cellular masses however this is not visible at the same section level. E and G show HuC/D and elavl3 expression at the telencephalic/ORR border whereas F and H show at the ORR/hypothalamic region border. Scale bars = 50µm. |
|
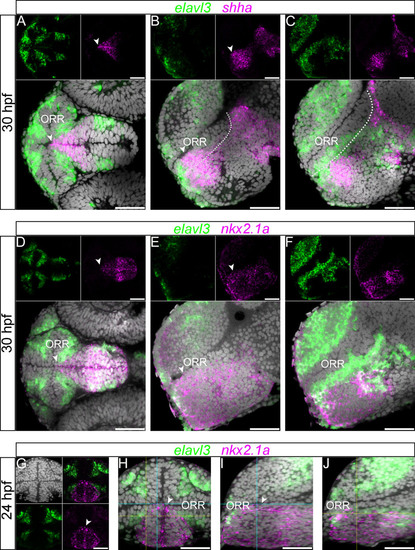
Expression of nkx2.1a and shha in the hypothalamic region. (A–C): 30hpf forebrain following elavl3 and shha in situ hybridization and DAPI staining (gray). The shha expression in the rostral edge of the hypothalamus displays a conical shape inserted into the ORR, which is visible in the ventral view (A). The expression reaches the ventricle at the most medial level (arrow heads of A and B), but not at a more lateral level (C).The currently proposed alar/basal limit is shown in dotted lines in the lateral sections (B and C), and it does not completely match the expression of shha in the anterior part of the forebrain. Scale bars = 50µm. (D–F): 30hpf forebrain following elavl3 and nkx2.1a in situ hybridization and DAPI staining (gray). The expression domain is also conical shaped in the ventral view (D), and it reaches the ventricle at the most medial level (arrow heads of D and E), but not at a more lateral level (F). (G–J): 24hpf forebrain following elavl3 and nkx2.1a in situ hybridization and DAPI staining (gray) illustrated in a single confocal plane of a frontal view (G and H) and two lateral views (I and J) reconstructed using Z-projections of the frontal images. Corresponding section levels of the two lateral views are indicated in blue (more medial) and yellow (more lateral) lines. The expression domain of nkx2.1a has a conical shape, visible in the frontal view (G and H). Its dorsal limit reaches the ventricle only in the section close to the midline (arrow heads in G–I) and not in the more lateral section (J). |
|
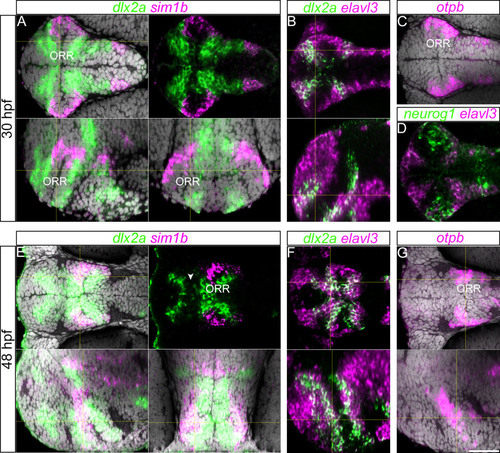
Gene expression along the ORR. (A): 30hpf forebrain following dlx2a and sim1a in situ hybridization and DAPI staining (gray) on a single confocal plane of a ventral (top panels), lateral (left bottom panel) and frontal views (right bottom panel) reconstructed using Z-projections of the ventral images. Corresponding section levels are indicated in yellow lines (same for B, E–G). (B): Single confocal plane of a 30hpf forebrain following dlx2a and elavl3 in situ hybridization in ventral view (top panel) and lateral view reconstructed using Z-projections of the ventral images (bottom panel). (C): Single confocal plane of a 30hpf forebrain following otpb in situ hybridization and DAPI staining (gray) illustrated in a ventral view. In the ORR, the expression pattern of otpb is similar to the sim1a staining. (D): Single confocal plane of a 30hpf forebrain following neurog1 and elavl3 in situ hybridization in ventral view. In the ORR, the expression pattern of neurog1 is similar to the sim1a and otpb staining covering the lateral end of the region. (E): 48hpf forebrain following dlx2a and sim1a in situ hybridization and DAPI staining (gray), single confocal plane of ventral view (top panels) and of lateral (left bottom panel) and frontal (right bottom panel) views reconstructed using Z-projections of the ventral images. The arrow head in the right top panel indicates the gap of two dlx2a-expressing domains in the telencephalon and ORR. (F): 48hpf forebrain following dlx2a and elavl3 in situ hybridization in a single confocal plane of ventral view (top panel) and of lateral view reconstructed using Z-projections of the ventral images (bottom panel). (G): 48hpf forebrain following otpb in situ hybridization and DAPI staining (gray) on a single confocal plane of ventral view (top panels) and of lateral view reconstructed using Z-projections of the ventral images (bottom panel). Corresponding section levels are indicated in yellow lines. |
|
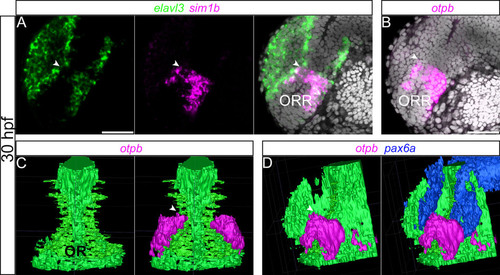
3D demonstration of the subdivision in the ORR. (A–B): Single confocal plane of a lateral view of a 30hpf forebrain following elavl3 and sim1a (A) or otpb (B) in situ hybridization and DAPI staining (gray). (C–D): 3D rendering from confocal images following otpb and pax6a in situ hybridization and DAPI staining, illustrated in a frontal (C) and a lateral (D) views. Ventricle shape of the optic recess (OR) was deduced from DAPI staining and segmented manually using ITK-SNAP 2.4.0. otpb- and pax6a-positive domains were segmented semi-automatically using ITK- SNAP 2.4.0. The expression of sim1a and otpb delineates the dorsal limit of the ORR (arrow heads), which fits the inversion of the curvature of the ventricle (C and D). Pax6a (D), which is known to be expressed in the dorsal domain of the forebrain, shows the complementary expression pattern with otpb. Scale bars = 50µm. |
|
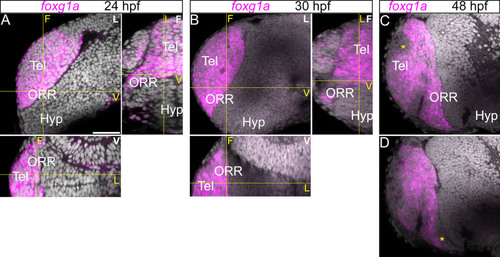
Expression of foxg1a in the telencephalic region. Anterior forebrain region following foxg1a in situ hybridization and DAPI staining (gray) at 24 (A), 30 (B) and 48hpf (C). (A–B): A single confocal plane of a lateral view (left top panel; indicated “L” in white) and the frontal (right top; indicated “F” in white) and ventral (bottom panel; indicated “V” in white) views reconstructed using Z-projections of the lateral images. Corresponding section levels are indicated in yellow lines and yellow letters. The foxg1a is expressed in the entire region antero-dorsal to the optic recess. (C–D): A single confocal plane of two different lateral views at 48hpf (C more medial and D more lateral). The expression of foxg1a is reduced at 48hpf in some territories (*). Scale bar = 50µm. |

