
Fig. 7
- ID
- ZDB-FIG-150422-14
- Publication
- Affaticati et al., 2015 - Identification of the optic recess region as a morphogenetic entity in the zebrafish forebrain
- Other Figures
- All Figure Page
- Back to All Figure Page
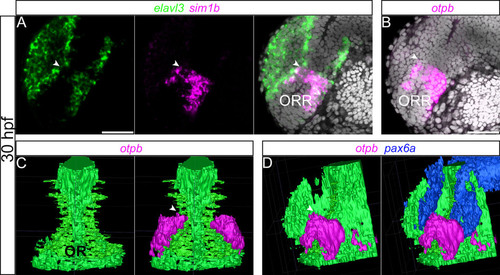
3D demonstration of the subdivision in the ORR. (A–B): Single confocal plane of a lateral view of a 30hpf forebrain following elavl3 and sim1a (A) or otpb (B) in situ hybridization and DAPI staining (gray). (C–D): 3D rendering from confocal images following otpb and pax6a in situ hybridization and DAPI staining, illustrated in a frontal (C) and a lateral (D) views. Ventricle shape of the optic recess (OR) was deduced from DAPI staining and segmented manually using ITK-SNAP 2.4.0. otpb- and pax6a-positive domains were segmented semi-automatically using ITK- SNAP 2.4.0. The expression of sim1a and otpb delineates the dorsal limit of the ORR (arrow heads), which fits the inversion of the curvature of the ventricle (C and D). Pax6a (D), which is known to be expressed in the dorsal domain of the forebrain, shows the complementary expression pattern with otpb. Scale bars = 50µm. |