
Fig. 8
- ID
- ZDB-FIG-150422-15
- Publication
- Affaticati et al., 2015 - Identification of the optic recess region as a morphogenetic entity in the zebrafish forebrain
- Other Figures
- All Figure Page
- Back to All Figure Page
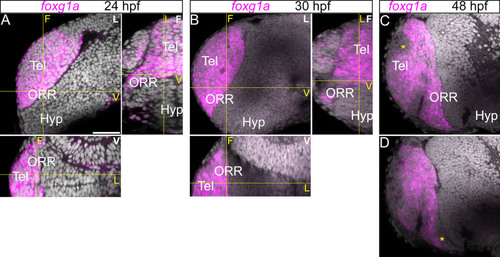
Expression of foxg1a in the telencephalic region. Anterior forebrain region following foxg1a in situ hybridization and DAPI staining (gray) at 24 (A), 30 (B) and 48hpf (C). (A–B): A single confocal plane of a lateral view (left top panel; indicated “L” in white) and the frontal (right top; indicated “F” in white) and ventral (bottom panel; indicated “V” in white) views reconstructed using Z-projections of the lateral images. Corresponding section levels are indicated in yellow lines and yellow letters. The foxg1a is expressed in the entire region antero-dorsal to the optic recess. (C–D): A single confocal plane of two different lateral views at 48hpf (C more medial and D more lateral). The expression of foxg1a is reduced at 48hpf in some territories (*). Scale bar = 50µm. |