
Fig. 6
- ID
- ZDB-FIG-150422-13
- Publication
- Affaticati et al., 2015 - Identification of the optic recess region as a morphogenetic entity in the zebrafish forebrain
- Other Figures
- All Figure Page
- Back to All Figure Page
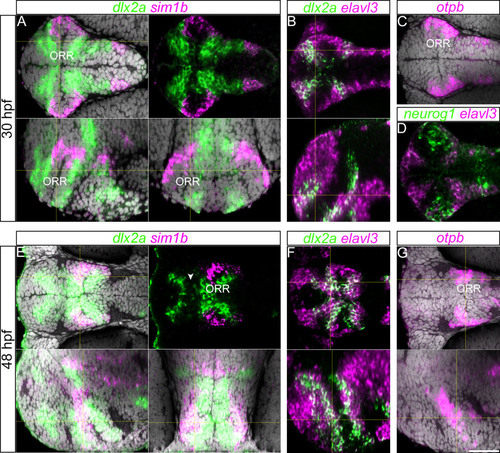
Gene expression along the ORR. (A): 30hpf forebrain following dlx2a and sim1a in situ hybridization and DAPI staining (gray) on a single confocal plane of a ventral (top panels), lateral (left bottom panel) and frontal views (right bottom panel) reconstructed using Z-projections of the ventral images. Corresponding section levels are indicated in yellow lines (same for B, E–G). (B): Single confocal plane of a 30hpf forebrain following dlx2a and elavl3 in situ hybridization in ventral view (top panel) and lateral view reconstructed using Z-projections of the ventral images (bottom panel). (C): Single confocal plane of a 30hpf forebrain following otpb in situ hybridization and DAPI staining (gray) illustrated in a ventral view. In the ORR, the expression pattern of otpb is similar to the sim1a staining. (D): Single confocal plane of a 30hpf forebrain following neurog1 and elavl3 in situ hybridization in ventral view. In the ORR, the expression pattern of neurog1 is similar to the sim1a and otpb staining covering the lateral end of the region. (E): 48hpf forebrain following dlx2a and sim1a in situ hybridization and DAPI staining (gray), single confocal plane of ventral view (top panels) and of lateral (left bottom panel) and frontal (right bottom panel) views reconstructed using Z-projections of the ventral images. The arrow head in the right top panel indicates the gap of two dlx2a-expressing domains in the telencephalon and ORR. (F): 48hpf forebrain following dlx2a and elavl3 in situ hybridization in a single confocal plane of ventral view (top panel) and of lateral view reconstructed using Z-projections of the ventral images (bottom panel). (G): 48hpf forebrain following otpb in situ hybridization and DAPI staining (gray) on a single confocal plane of ventral view (top panels) and of lateral view reconstructed using Z-projections of the ventral images (bottom panel). Corresponding section levels are indicated in yellow lines. |