
Fig. 2
- ID
- ZDB-FIG-150422-9
- Publication
- Affaticati et al., 2015 - Identification of the optic recess region as a morphogenetic entity in the zebrafish forebrain
- Other Figures
- All Figure Page
- Back to All Figure Page
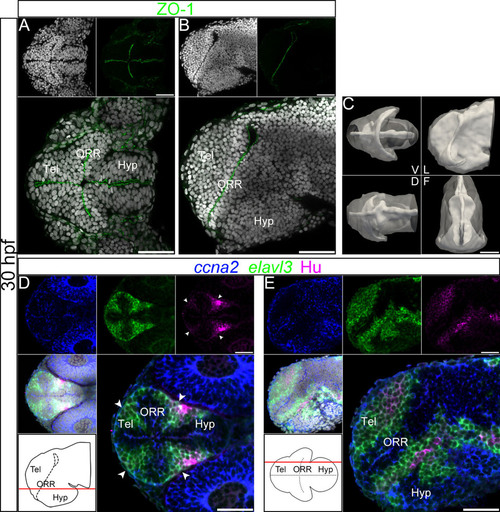
Ventricular organization and the centrifugal gradient of neurogenesis at 30hpf. (A–B): Single confocal plane of a 30hpf embryonic forebrain stained with DAPI (gray) and immunolabeled for ZO-1, in ventral (A) and lateral (B) views. (C): Surface rendering of the shape of ventricle (white, in opacity), reconstructed from ZO-1 immunolabeling, overlapped on the shape of the brain (white, in transparency), reconstructed from DAPI staining. V = ventral, D = dorsal, L = lateral and F = frontal views. At 30hpf the organization of the ventricular system is less complex than at 48hpf. The frontal view displays a characteristic keyhole shape of the ventricle, with a larger lateral expansion of the ventral part compared to the dorsal part. (D–E): Single confocal plane of a 30hpf embryonic forebrain labeled with the neurogenic markers ccna2, elavl3 and HuC/D, in ventral (D) and lateral (E) views. Bottom left drawings show the level of the corresponding optical plane. The ccna2 staining is located around the ventricular walls but in wider territories than at 48hpf. The elavl3 staining is detected adjacent to the ccna2 staining, also in wider territories than at 48hpf. Accordingly, much fewer HuC/D-positive cells are detected than at 48hpf, and they are all distributed at the periphery of the neural tube. The arrowheads in D indicate Hu-expressing cells located at the boundaries of telencephalon/ORR and ORR/hypothalamus. Scale bars = 50µm. |