- Title
-
Mature osteoblasts dedifferentiate in response to traumatic bone injury in the zebrafish fin and skull
- Authors
- Geurtzen, K., Knopf, F., Wehner, D., Huitema, L.F., Schulte-Merker, S., Weidinger, G.
- Source
- Full text @ Development
|
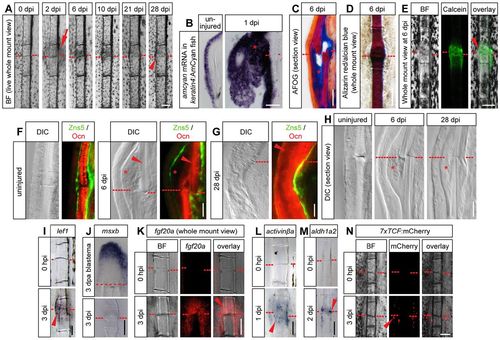
Fracture model in zebrafish bony fin rays. (A) Whole-mount view of the same fractured fin ray at different time points post injury. Red dashed line, fracture; arrow, epidermal thickening; arrowhead, thickened bone. (B) Epidermal thickening at 1dpi identified by in situ hybridization against amcyan mRNA in keratin4:AmCyan transgenic fish. (C) Longitudinal section view of an AFOG-stained fin hemiray at 6dpi with collagen staining blue (asterisk). (D) Whole-mount view of an Alizarin Red/Alcian Blue stained fin ray at 6dpi. The lack of blue staining indicates intramembranous ossification. (E) Whole-mount view of a fin ray at 6dpi stained with Calcein indicates calcium incorporation into the mineralizing callus. (F,G) Immunofluorescence on longitudinal sections of individual hemirays stained for the pan-osteoblast marker Zns5 and Osteocalcin (Ocn), labeling mature bone matrix. Note the absence of Osteocalcin in the callus tissue at 6dpi (asterisk), but presence at 28dpi (arrowhead). DIC, differential interference contrast. (H) Longitudinal sections of individual fractured hemirays. Asterisk, hard callus. (I-M) Expression of the indicated genes detected by chromogenic (I,J,L,M) or fluorescent (K) whole-mount in situ hybridizations on fractured rays or amputated fins (J). (N) mCherry fluorescence is induced in fractured 7xTCF:mCherry Wnt reporter fish at 3dpi. Scale bars: 100µm in A,D,E,I-N; 50µm in B,C; 20µm in F-H. BF, brightfield. |
|
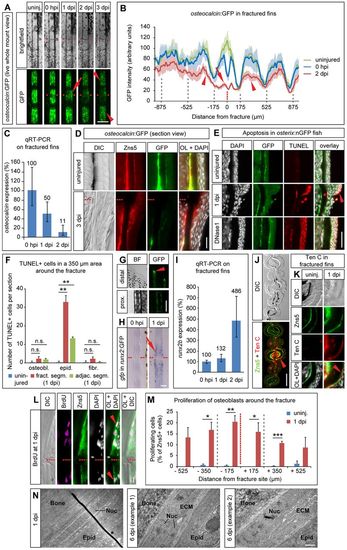
Osteoblasts in the fractured bony fin ray undergo dedifferentiation. (A) Live whole-mount view of a fractured fin ray in the same osteocalcin:GFP transgenic fish imaged at different time points. GFP levels drop in the fractured (arrow) and adjacent (arrowheads) segments. (B) Quantification of osteocalcin:GFP expression showing average GFP intensity±s.e.m. Arrow, fractured segment; arrowheads, adjacent segments. GFP intensity is not reduced by introduction of the fracture, except at the direct fracture site (compare blue curve with green curve). Gray dashed lines, segment boundaries. (C) Endogenous osteocalcin levels determined by qRT-PCR on fractured plus adjacent segments and shown relative to the levels at 0hpi. Error bars, s.d. (D) Longitudinal section view of osteocalcin:GFP uninjured and 3dpi hemirays stained with antibodies against GFP and Zns5. In contrast to uninjured fins, at 3dpi GFP can be hardly detected in Zns5+ osteoblasts. OL, overlay. (E) Apoptotic cells detected by TUNEL staining in longitudinal sections of osterix:nGFP fish are mainly found in the epidermal cell layer overlying the fracture (arrowhead) and only occasionally in osteoblasts (asterisk). DNase1-treated sections were used as positive control. (F) Quantification of experiment shown in E. Error bars, s.e.m. **Pd0.01 Student′s t-test; n.s., not significantly different. (G) GFP expression in uninjured runx2:GFP transgenic fish is largely confined to the distalmost tips of the growing fin rays. prox., proximal. (H) Whole-mount in situ hybridization against gfp in runx2:GFP transgenic fish fin rays at 0hpi and 1dpi reveals induction of transgene expression at the fracture site (arrow). (I) Endogenous runx2b levels determined by qRT-PCR on fractured rays plus adjacent segments and normalized to the level at 0hpi. Error bars, s.d. (J) Anti-Tenascin C and Zns5 antibody staining on cross-sections of three bony fin rays, the central ray of which had been fractured a day earlier. Tenascin C expression is present in osteoblasts and fibroblasts of the fractured fin ray (arrowhead) and extends into the fibroblast population of the interray (asterisks). (K) Magnified view of staining as in J. (L) Zns5+ osteoblasts in the proximity of the fracture incorporate BrdU (arrowheads). Longitudinal sections. (M) Quantification of experiment shown in L. BrdU+ Zns5+ cells were counted in bins of 175µm. Gray dashed lines, segment boundaries. Error bars, s.e.m. *Pd0.05. **Pd0.01. ***Pd0.001, Student′s t-test. (N) Osteoblasts change their ultrastructure upon injury, determined by TEM. ECM, extracellular matrix; Nuc, nucleus/nuclei. *, artefact from staining procedure. Scale bars: 200µm in A,G; 20µm in D; 50µm in E,H; 100µm in J; 10µm in K,L; 1µm in N. |
|
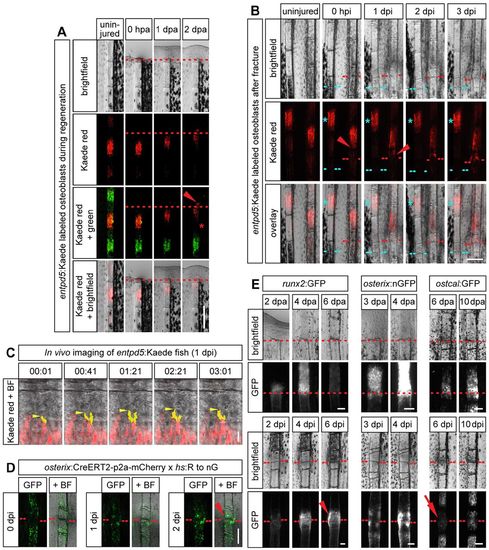
Dedifferentiated osteoblasts migrate toward the injury site, where they redifferentiate. (A) entpd5:Kaede is expressed in mature osteoblasts in the center of the bony fin ray segments. In response to fin amputation, photoconverted osteoblasts (red) migrate to and beyond the amputation plane (arrowhead), as seen by repeated imaging of the same fish. At the same time the gap devoid of labeled osteoblasts at the segment boundary widens (asterisk). (B) Photoconverted osteoblasts in entpd5:Kaede transgenic fish in a segment adjacent to a fracture (right fin ray, arrowhead) or in the second segment from the fracture (left ray, asterisk). Osteoblasts migrate toward the fracture only from the segment adjacent to it. (C) Still images from a confocal time-lapse movie of migrating photoconverted Kaede+ osteoblasts in close proximity to the fracture. Protrusions of one cell are highlighted in yellow, its leading edge with an arrowhead. (D) osterix+ cells or their progeny accumulate at the fracture at 2dpi (arrowhead), as revealed by stochastic Cre-mediated genetic labeling of osteoblasts in osterix:CreERT2-p2a-mCherry×hs:R to nG fish. (E) Comparison of transgene expression in runx2:GFP, osterix:nGFP and osteocalcin:GFP fins during regeneration after amputation (upper panels) versus repair after fracture (lower panels). ostcal, osteocalcin. Scale bars: 200µm in A,B,D; 20µm in C; 100µm in E. EXPRESSION / LABELING:
|
|
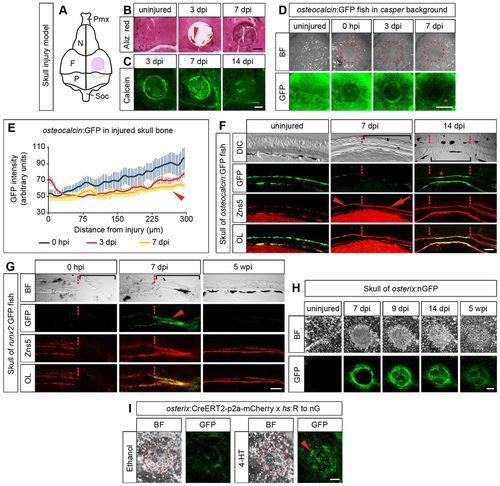
Osteoblasts in dermal bone of the skull dedifferentiate following injury. (A) Scheme illustrating the bone injury (500µm hole) in the os frontale (purple filled circle) or at the boundary between the os frontale and os parietale (empty circle) of the dorsal skull. F, os frontale; N, os nasale; P, os parietale; Pmx, os praemaxillare; Soc, os supraoccipitale. (B) Whole-mount view of uninjured and injured skulls at different times post injury stained with Alizarin Red. Arrowhead, islands of bone matrix. (C) Calcein staining of whole-mount injured skulls at different times post injury. (D) Reduction of GFP signal intensity in osteocalcin:GFP transgenic fish in proximity to the drill injury (asterisk), revealed by repeated live imaging of the same fish. (E) Quantification of experiment shown in D. Error bars, s.e.m. (F,G) Immunofluorescence of transverse sections of the dorsal skull stained for GFP and Zns5. Bracket, injury site; dashed line, injury boundary; arrowhead, osteoblasts in uninjured area; arrow, osteoblasts lining newly formed matrix in injury area. (F) osteocalcin:GFP fish. (G) runx2:GFP fish. Arrowhead, GFP+ osteoblasts lining newly formed matrix in injury area. (H) Skull of an osterix:nGFP fish before and after injury. (I) osterix+ osteoblasts contribute to repair of skull bone after injury. In osterix:CreERT2-p2a-mCherry×hs:R to nG double transgenic fish genetically labeled osteoblasts (bright nuclear signals) cover the injury site at 7dpi (arrowhead). Only background fluorescence is detected in vehicle (ethanol)-treated fish. Scale bars: 200µm in B,C,H,I; 500µm in D; 50µm in F,G. |
|
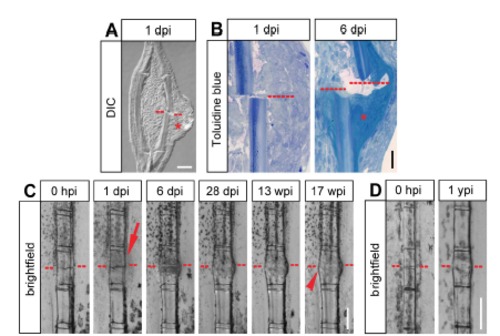
Soft and hard callus formation in fractured fin rays. (A) Longitudinal section view of a fractured fin ray at 1 dpi. The fracture site is indicated by the red dashed line. A swelling covering the fractured hemiray is visible (asterisk). Scale bar, 50 µm. DIC, differential interference contrast. dpi, day post injury. (B) Toluidine blue stained sections of fractured fin hemirays at 1 dpi and 6 dpi. At 6 dpi, collagenous tissue has accumulated at the fracture site (asterisk). Scale bar, 30 µm. (C) Bone fractures in the fin ray heal, however the bone keeps a thickened appearance up to at least 4 months post injury. Live whole mount view of the same fin ray at different time points post fracture. The epidermal thickening forming at 1 dpi is indicated by the arrow. The thickened appearance of the fractured segment is indicated by the arrowhead. Scale bar, 200 µm. hpi, hours post injury. wpi, weeks post injury. (D) The fractured fin ray segment is distinguishable from neighboring unfractured segments at 1 year post injury (ypi). Live whole mount view of the same fin ray at 0 hpi and 1 year later. The thickened bone is indicated by the arrowhead. Scale bar, 200 µm. |
|
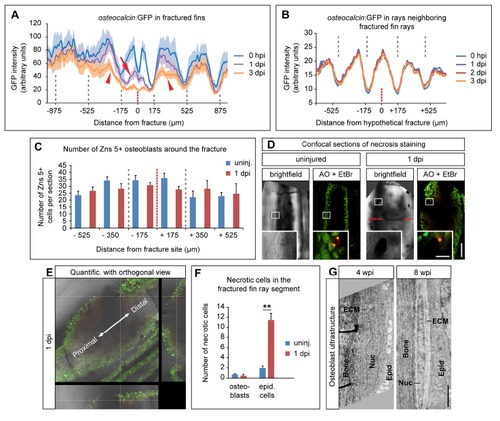
Osteoblasts do not die after fracture and osteocalcin downregulation is not a systemic effect. (A) GFP intensity plot illustrating reduced levels of GFP in the fractured (arrow) and adjacent (arrowheads) segments after injury at 1 and 3 dpi. The grey dashed lines indicate segment boundaries, while the red dashed line indicates the fracture site. Average GFP intensity ± s.e.m. is shown. dpi, day(s) post injury. hpi, hours post injury. (B) osteocalcin:GFP downregulation is not a systemic response. GFP intensity measurements in uninjured fin rays neighboring fractured fin rays reveal that there is no reduction of GFP signal after injury. (C) The number of Zns5+ osteoblasts is not significantly altered at 1 dpi when compared to uninjured fins. Absolute numbers of osteoblasts per longitudinal section in bins of 175 µm along the fractured fin ray are shown. There are no significant differences (Student’s t-test) in the respective uninjured versus 1 dpi groups. Note that 1 fin ray segment is approximately 350 µm long. Error bars, s.e.m. uninj. = uninjured. (D) Confocal (optical section) view of an uninjured versus 1 dpi whole mount fin ray stained for necrotic cells using acridine orange and ethidium bromide Necrotic cells are labeled in both green (acridine orange) and red (ethidium bromide) at the same time. Necrosis of osteoblasts is a rare event both in uninjured and injured fin rays. One necrotic osteoblast in each example is shown in the magnified view. Osteoblasts were identified by their position in the cell layer directly abutting the bone matrix. Scale bar (overview), 50 µm. Scale bar (magnified view), 10 µm. AO = acridine orange. EtBr = Ethidium bromide. (E) Orthogonal view method used for quantification of necrotic cells on confocal (optical) sections. Depending on the location of the necrotic cell either close to the surface (epidermal cell layers) or the deeper bone matrix (osteoblast cell layers) necrotic cells were counted as either epidermal cells or osteoblasts. The example shown here represents a necrotic osteoblast. Quantific. = quantification. (F) Quantification of the experiments depicted in (D) and (E). While osteoblast necrosis is unchanged after fin ray fracture, epidermal cells undergo significantly enhanced necrosis after injury. Error bars, s.e.m. **, p d 0.01, Student’s t-test. (G) Osteoblasts keep a rounded morphology and ultrastructure indicative of bone matrix production for at least 4 weeks post injury, and adopt their original elongated appearance only some weeks later. Electron micrographs of osteoblasts at 4 and 8 wpi. Scale bar, 2 µm. ECM = extracellular matrix, Epid = epidermis, Nuc = nucleus. |
|
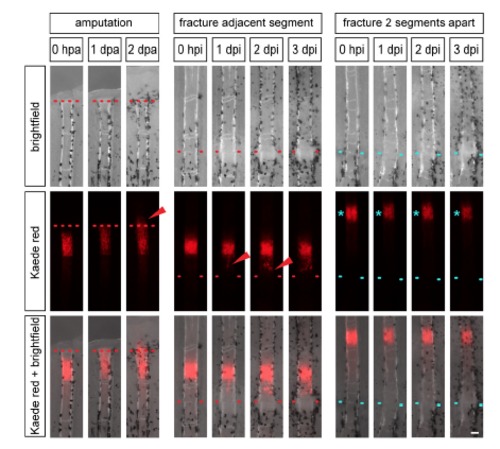
Dedifferentiated osteoblasts migrate to the site of injury. Individual entpd5:Kaede fish were repeatedly imaged at the indicated time points. Left: In response to fin amputation, photoconverted osteoblasts of entpd5:Kaede transgenic fish (red) migrate to and beyond the amputation plane (arrowhead) as seen by repeated imaging of the same fish. Middle: Photoconverted osteoblasts in a segment adjacent to a fracture migrate towards the fracture (arrowhead). Right: Photoconverted osteoblasts in the second segment from the fracture do not change position. Red and blue dotted lines, fracture. Scale bar, 100 µm. |
|
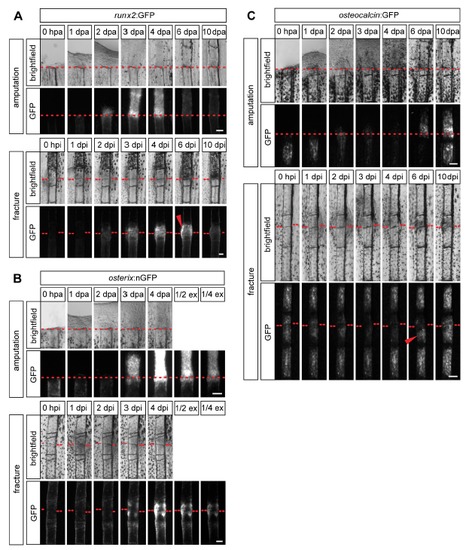
Timing of osteogenesis is similar in fractured versus amputated fin rays, but progression to late osteoblasts is delayed in fractures. (A) Time course of transgene expression in runx2:GFP fins during regeneration after amputation versus repair after fracture. GFP fluorescence is visible from 2 dpa/i in both injury models. runx2:GFP expression is reduced again to levels of uninjured fins at 6 dpa, while it is still high at this time point in fractured fin rays (arrowhead). (B) Time course of transgene expression in osterix:nGFP fins. GFP fluorescence is visible at 3 dpa/i in a similar intensity and is increased at 4 dpa/i in both injury models. ex, exposure. (C) Time course of transgene expression in osteocalcin:GFP fins. GFP fluorescence drops after injury up to 4 dpa/i in both injury models and recurs at 6 dpa in regenerating fins. In fractured fin rays expression levels are equally re-induced at 6 dpi in half of the cases looked at (arrowhead). GFP fluorescence throughout the fractured segment is completely re-established at 10 dpi. dpa, day(s) post amputation. dpi, day(s) post injury. |

